Taiwanese vs Tongan Median Family Income
COMPARE
Taiwanese
Tongan
Median Family Income
Median Family Income Comparison
Taiwanese
Tongans
$107,295
MEDIAN FAMILY INCOME
91.4/ 100
METRIC RATING
125th/ 347
METRIC RANK
$105,967
MEDIAN FAMILY INCOME
84.3/ 100
METRIC RATING
143rd/ 347
METRIC RANK
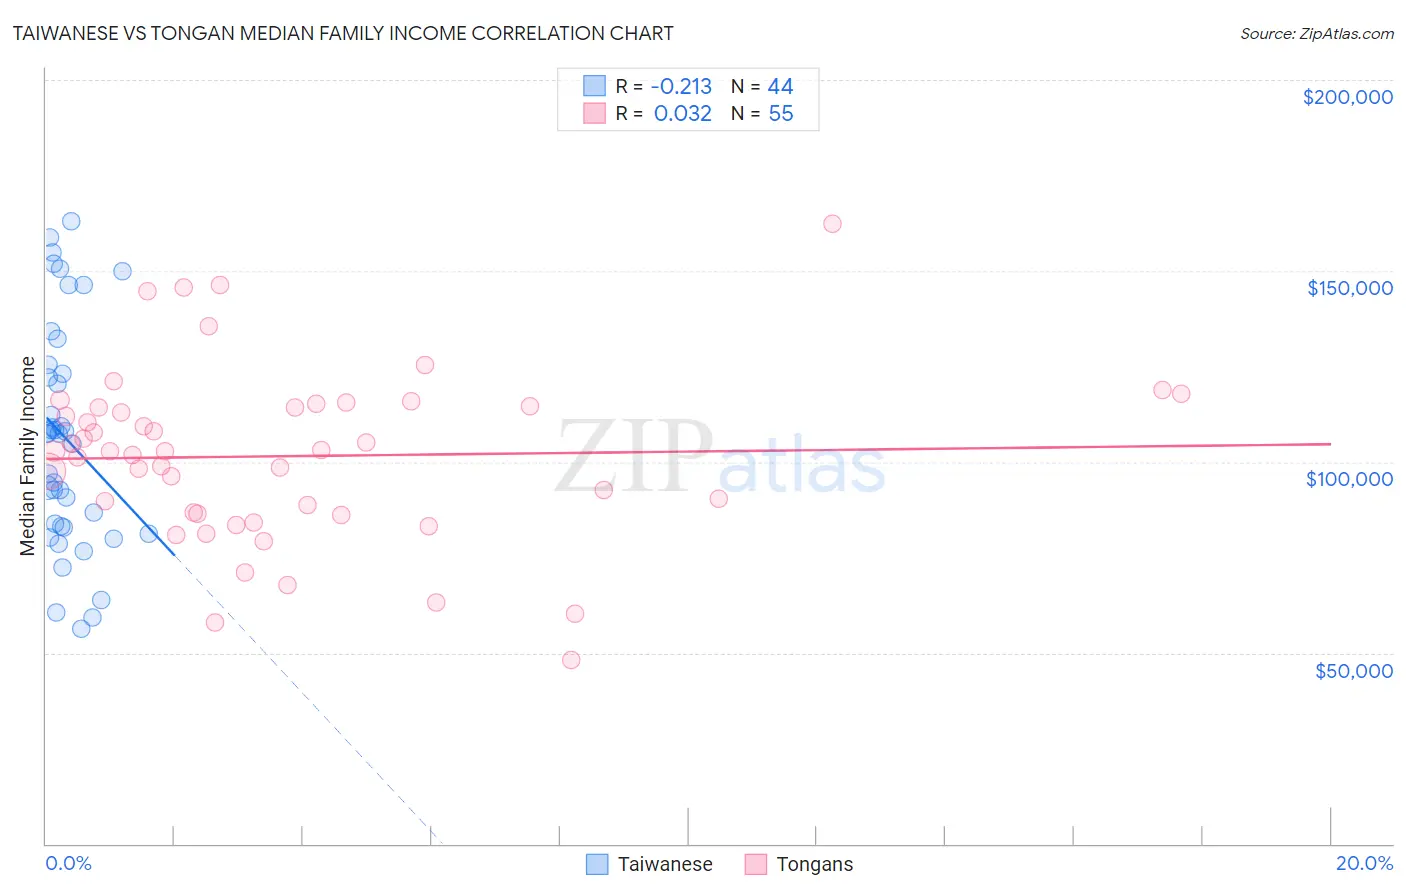
Taiwanese vs Tongan Median Family Income Correlation Chart
The statistical analysis conducted on geographies consisting of 31,709,765 people shows a weak negative correlation between the proportion of Taiwanese and median family income in the United States with a correlation coefficient (R) of -0.213 and weighted average of $107,295. Similarly, the statistical analysis conducted on geographies consisting of 102,775,236 people shows no correlation between the proportion of Tongans and median family income in the United States with a correlation coefficient (R) of 0.032 and weighted average of $105,967, a difference of 1.3%.
Median Family Income Correlation Summary
| Measurement | Taiwanese | Tongan |
| Minimum | $56,146 | $48,125 |
| Maximum | $162,974 | $162,500 |
| Range | $106,828 | $114,375 |
| Mean | $106,094 | $101,505 |
| Median | $107,372 | $102,675 |
| Interquartile 25% (IQ1) | $83,038 | $86,338 |
| Interquartile 75% (IQ3) | $124,300 | $114,438 |
| Interquartile Range (IQR) | $41,262 | $28,100 |
| Standard Deviation (Sample) | $29,129 | $22,609 |
| Standard Deviation (Population) | $28,796 | $22,402 |
Demographics Similar to Taiwanese and Tongans by Median Family Income
In terms of median family income, the demographic groups most similar to Taiwanese are Pakistani ($107,390, a difference of 0.090%), Serbian ($107,157, a difference of 0.13%), Lebanese ($107,086, a difference of 0.19%), Immigrants from Ethiopia ($106,969, a difference of 0.30%), and Arab ($106,952, a difference of 0.32%). Similarly, the demographic groups most similar to Tongans are Immigrants from Morocco ($105,964, a difference of 0.0%), Slovene ($106,020, a difference of 0.050%), Immigrants from Syria ($106,118, a difference of 0.14%), Norwegian ($106,144, a difference of 0.17%), and Luxembourger ($106,183, a difference of 0.20%).
| Demographics | Rating | Rank | Median Family Income |
| Pakistanis | 91.7 /100 | #124 | Exceptional $107,390 |
| Taiwanese | 91.4 /100 | #125 | Exceptional $107,295 |
| Serbians | 90.8 /100 | #126 | Exceptional $107,157 |
| Lebanese | 90.5 /100 | #127 | Exceptional $107,086 |
| Immigrants | Ethiopia | 90.0 /100 | #128 | Excellent $106,969 |
| Arabs | 89.9 /100 | #129 | Excellent $106,952 |
| Brazilians | 89.8 /100 | #130 | Excellent $106,942 |
| Canadians | 88.1 /100 | #131 | Excellent $106,597 |
| Immigrants | Fiji | 87.8 /100 | #132 | Excellent $106,544 |
| Ugandans | 87.8 /100 | #133 | Excellent $106,541 |
| Immigrants | Oceania | 87.3 /100 | #134 | Excellent $106,453 |
| Portuguese | 86.3 /100 | #135 | Excellent $106,286 |
| Immigrants | South Eastern Asia | 86.1 /100 | #136 | Excellent $106,252 |
| Immigrants | Uganda | 85.7 /100 | #137 | Excellent $106,188 |
| Immigrants | Vietnam | 85.7 /100 | #138 | Excellent $106,186 |
| Luxembourgers | 85.7 /100 | #139 | Excellent $106,183 |
| Norwegians | 85.5 /100 | #140 | Excellent $106,144 |
| Immigrants | Syria | 85.3 /100 | #141 | Excellent $106,118 |
| Slovenes | 84.7 /100 | #142 | Excellent $106,020 |
| Tongans | 84.3 /100 | #143 | Excellent $105,967 |
| Immigrants | Morocco | 84.3 /100 | #144 | Excellent $105,964 |