Taiwanese vs Albanian College, Under 1 year
COMPARE
Taiwanese
Albanian
College, Under 1 year
College, Under 1 year Comparison
Taiwanese
Albanians
66.4%
COLLEGE, UNDER 1 YEAR
78.6/ 100
METRIC RATING
148th/ 347
METRIC RANK
65.9%
COLLEGE, UNDER 1 YEAR
66.1/ 100
METRIC RATING
160th/ 347
METRIC RANK
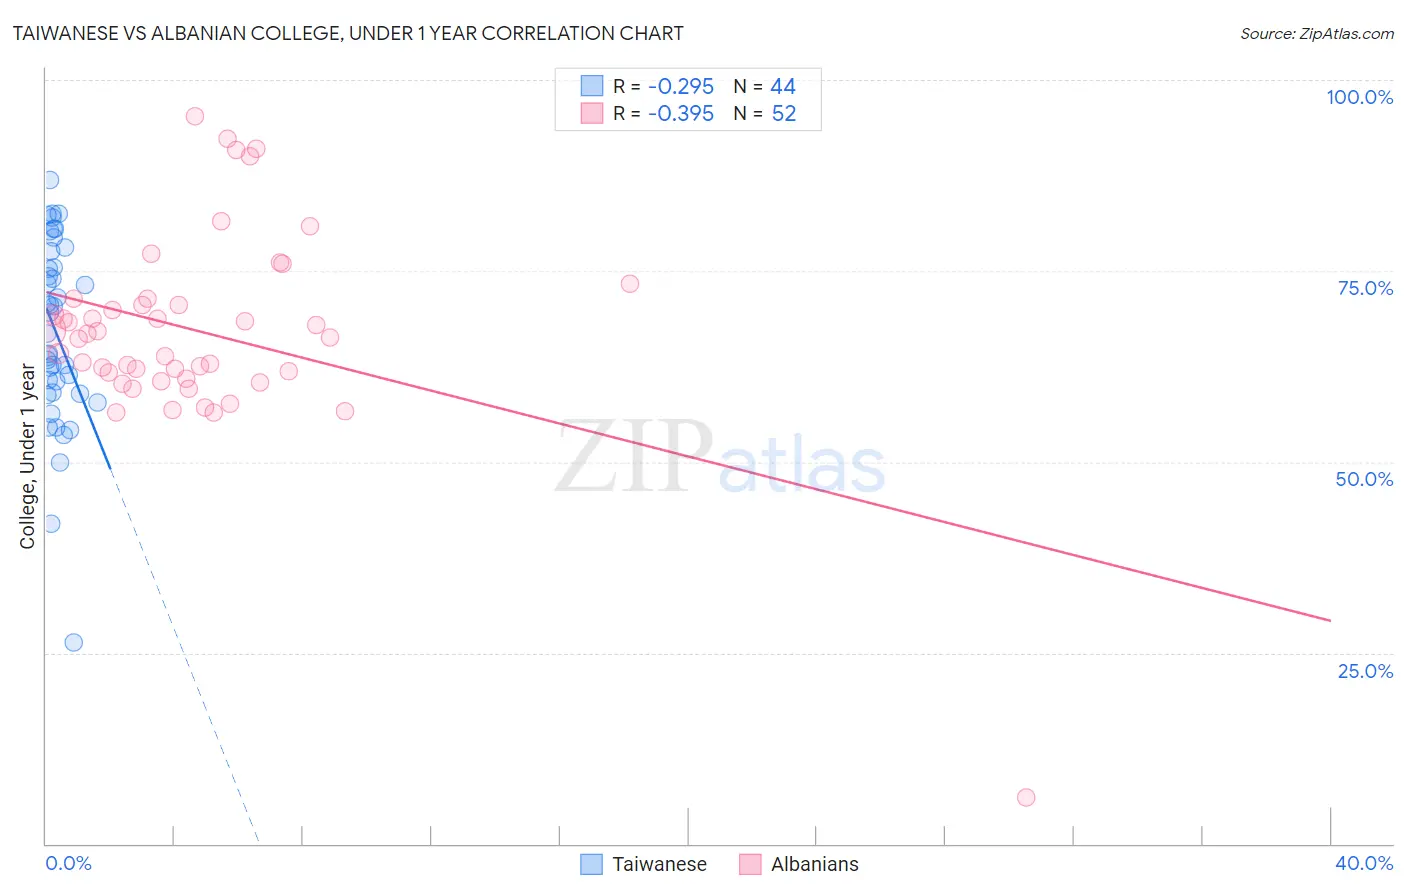
Taiwanese vs Albanian College, Under 1 year Correlation Chart
The statistical analysis conducted on geographies consisting of 31,724,936 people shows a weak negative correlation between the proportion of Taiwanese and percentage of population with at least college, under 1 year education in the United States with a correlation coefficient (R) of -0.295 and weighted average of 66.4%. Similarly, the statistical analysis conducted on geographies consisting of 193,265,850 people shows a mild negative correlation between the proportion of Albanians and percentage of population with at least college, under 1 year education in the United States with a correlation coefficient (R) of -0.395 and weighted average of 65.9%, a difference of 0.69%.
College, Under 1 year Correlation Summary
| Measurement | Taiwanese | Albanian |
| Minimum | 26.4% | 6.0% |
| Maximum | 86.9% | 95.3% |
| Range | 60.6% | 89.3% |
| Mean | 66.9% | 67.1% |
| Median | 68.2% | 66.5% |
| Interquartile 25% (IQ1) | 58.9% | 61.3% |
| Interquartile 75% (IQ3) | 76.5% | 70.9% |
| Interquartile Range (IQR) | 17.6% | 9.6% |
| Standard Deviation (Sample) | 12.3% | 13.1% |
| Standard Deviation (Population) | 12.1% | 13.0% |
Demographics Similar to Taiwanese and Albanians by College, Under 1 year
In terms of college, under 1 year, the demographic groups most similar to Taiwanese are Immigrants from Venezuela (66.3%, a difference of 0.040%), Immigrants from Iraq (66.3%, a difference of 0.090%), Immigrants from Sudan (66.2%, a difference of 0.16%), Kenyan (66.5%, a difference of 0.21%), and Immigrants from Morocco (66.5%, a difference of 0.21%). Similarly, the demographic groups most similar to Albanians are Tlingit-Haida (65.9%, a difference of 0.010%), Brazilian (65.9%, a difference of 0.010%), Korean (65.9%, a difference of 0.040%), Celtic (65.9%, a difference of 0.060%), and Sierra Leonean (66.0%, a difference of 0.080%).
| Demographics | Rating | Rank | College, Under 1 year |
| Immigrants | Germany | 82.0 /100 | #144 | Excellent 66.5% |
| Immigrants | Kenya | 81.8 /100 | #145 | Excellent 66.5% |
| Kenyans | 81.7 /100 | #146 | Excellent 66.5% |
| Immigrants | Morocco | 81.7 /100 | #147 | Excellent 66.5% |
| Taiwanese | 78.6 /100 | #148 | Good 66.4% |
| Immigrants | Venezuela | 77.9 /100 | #149 | Good 66.3% |
| Immigrants | Iraq | 77.1 /100 | #150 | Good 66.3% |
| Immigrants | Sudan | 76.0 /100 | #151 | Good 66.2% |
| Sudanese | 74.1 /100 | #152 | Good 66.2% |
| Belgians | 73.7 /100 | #153 | Good 66.2% |
| Immigrants | Eritrea | 71.9 /100 | #154 | Good 66.1% |
| Irish | 70.3 /100 | #155 | Good 66.0% |
| Welsh | 69.9 /100 | #156 | Good 66.0% |
| Sierra Leoneans | 67.8 /100 | #157 | Good 66.0% |
| Celtics | 67.3 /100 | #158 | Good 65.9% |
| Tlingit-Haida | 66.4 /100 | #159 | Good 65.9% |
| Albanians | 66.1 /100 | #160 | Good 65.9% |
| Brazilians | 66.0 /100 | #161 | Good 65.9% |
| Koreans | 65.3 /100 | #162 | Good 65.9% |
| Somalis | 62.7 /100 | #163 | Good 65.8% |
| Czechoslovakians | 62.6 /100 | #164 | Good 65.8% |