Lebanese vs Immigrants from Colombia Associate's Degree
COMPARE
Lebanese
Immigrants from Colombia
Associate's Degree
Associate's Degree Comparison
Lebanese
Immigrants from Colombia
48.8%
ASSOCIATE'S DEGREE
94.6/ 100
METRIC RATING
119th/ 347
METRIC RANK
46.0%
ASSOCIATE'S DEGREE
41.3/ 100
METRIC RATING
181st/ 347
METRIC RANK
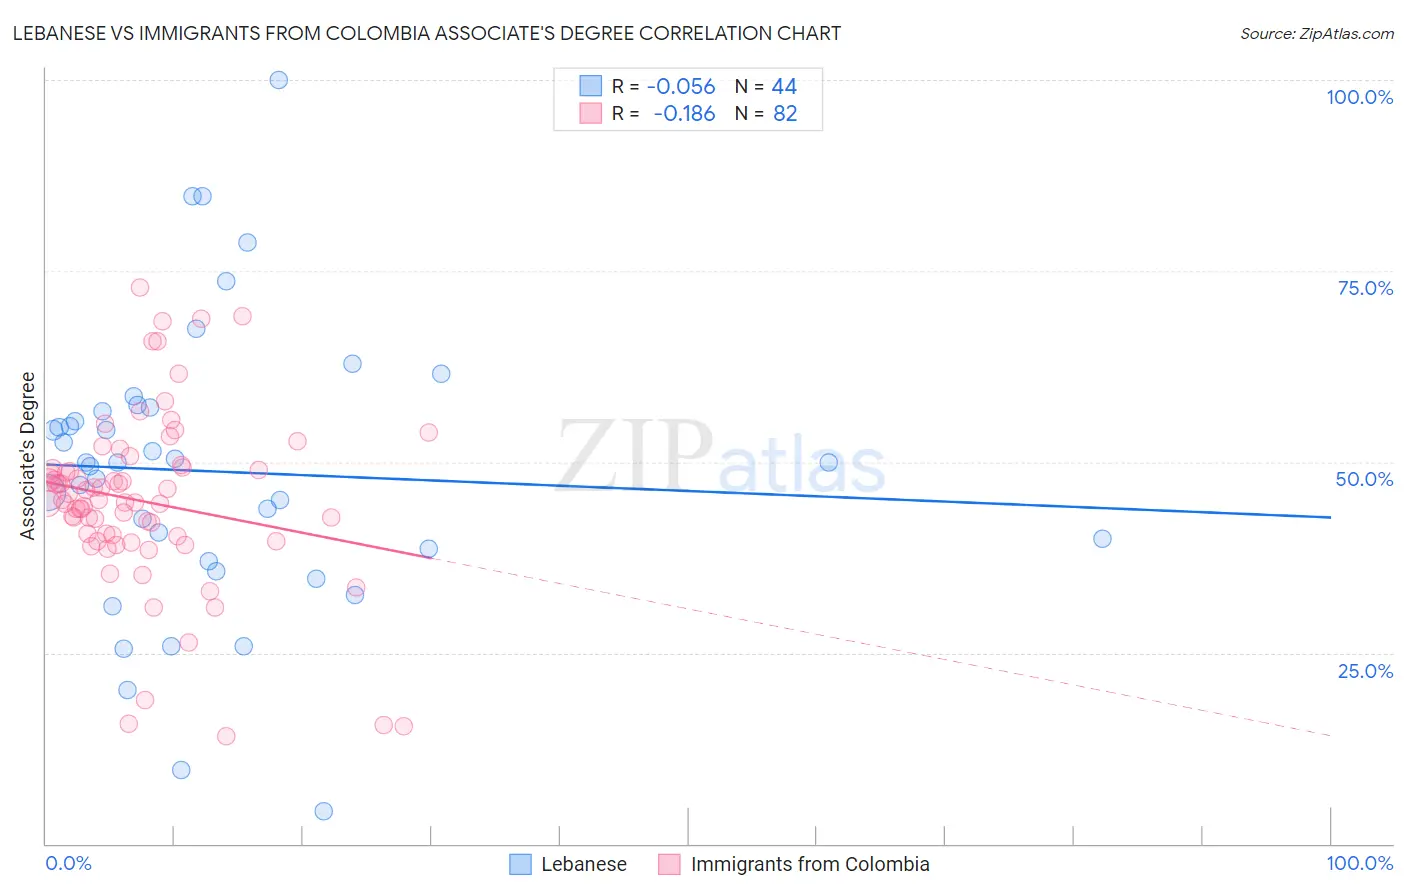
Lebanese vs Immigrants from Colombia Associate's Degree Correlation Chart
The statistical analysis conducted on geographies consisting of 401,605,631 people shows a slight negative correlation between the proportion of Lebanese and percentage of population with at least associate's degree education in the United States with a correlation coefficient (R) of -0.056 and weighted average of 48.8%. Similarly, the statistical analysis conducted on geographies consisting of 378,676,952 people shows a poor negative correlation between the proportion of Immigrants from Colombia and percentage of population with at least associate's degree education in the United States with a correlation coefficient (R) of -0.186 and weighted average of 46.0%, a difference of 6.1%.
Associate's Degree Correlation Summary
| Measurement | Lebanese | Immigrants from Colombia |
| Minimum | 4.3% | 14.1% |
| Maximum | 100.0% | 72.8% |
| Range | 95.7% | 58.7% |
| Mean | 48.7% | 44.8% |
| Median | 49.9% | 44.8% |
| Interquartile 25% (IQ1) | 37.8% | 40.3% |
| Interquartile 75% (IQ3) | 56.9% | 49.1% |
| Interquartile Range (IQR) | 19.1% | 8.8% |
| Standard Deviation (Sample) | 18.8% | 11.4% |
| Standard Deviation (Population) | 18.6% | 11.3% |
Similar Demographics by Associate's Degree
Demographics Similar to Lebanese by Associate's Degree
In terms of associate's degree, the demographic groups most similar to Lebanese are Albanian (48.8%, a difference of 0.010%), Alsatian (48.8%, a difference of 0.020%), Afghan (48.9%, a difference of 0.070%), British (48.9%, a difference of 0.12%), and Luxembourger (48.9%, a difference of 0.18%).
| Demographics | Rating | Rank | Associate's Degree |
| Immigrants | Chile | 95.3 /100 | #112 | Exceptional 49.0% |
| Palestinians | 95.3 /100 | #113 | Exceptional 49.0% |
| Arabs | 95.3 /100 | #114 | Exceptional 49.0% |
| Luxembourgers | 95.1 /100 | #115 | Exceptional 48.9% |
| British | 95.0 /100 | #116 | Exceptional 48.9% |
| Afghans | 94.8 /100 | #117 | Exceptional 48.9% |
| Albanians | 94.7 /100 | #118 | Exceptional 48.8% |
| Lebanese | 94.6 /100 | #119 | Exceptional 48.8% |
| Alsatians | 94.6 /100 | #120 | Exceptional 48.8% |
| Ugandans | 93.9 /100 | #121 | Exceptional 48.7% |
| Italians | 93.9 /100 | #122 | Exceptional 48.7% |
| Brazilians | 93.7 /100 | #123 | Exceptional 48.7% |
| Serbians | 92.6 /100 | #124 | Exceptional 48.5% |
| Chinese | 92.5 /100 | #125 | Exceptional 48.5% |
| Immigrants | Syria | 92.2 /100 | #126 | Exceptional 48.5% |
Demographics Similar to Immigrants from Colombia by Associate's Degree
In terms of associate's degree, the demographic groups most similar to Immigrants from Colombia are Swiss (46.0%, a difference of 0.070%), Yugoslavian (46.0%, a difference of 0.080%), Czechoslovakian (46.0%, a difference of 0.10%), Costa Rican (46.0%, a difference of 0.21%), and Welsh (45.9%, a difference of 0.27%).
| Demographics | Rating | Rank | Associate's Degree |
| English | 50.0 /100 | #174 | Average 46.4% |
| Belgians | 48.9 /100 | #175 | Average 46.3% |
| Finns | 48.5 /100 | #176 | Average 46.3% |
| Slovaks | 48.4 /100 | #177 | Average 46.3% |
| Immigrants | Bosnia and Herzegovina | 48.3 /100 | #178 | Average 46.3% |
| Sri Lankans | 47.6 /100 | #179 | Average 46.3% |
| Bermudans | 46.4 /100 | #180 | Average 46.2% |
| Immigrants | Colombia | 41.3 /100 | #181 | Average 46.0% |
| Swiss | 40.4 /100 | #182 | Average 46.0% |
| Yugoslavians | 40.2 /100 | #183 | Average 46.0% |
| Czechoslovakians | 40.0 /100 | #184 | Average 46.0% |
| Costa Ricans | 38.6 /100 | #185 | Fair 46.0% |
| Welsh | 37.9 /100 | #186 | Fair 45.9% |
| Immigrants | Uruguay | 35.5 /100 | #187 | Fair 45.8% |
| Ghanaians | 35.5 /100 | #188 | Fair 45.8% |