Welsh vs Apache No Schooling Completed
COMPARE
Welsh
Apache
No Schooling Completed
No Schooling Completed Comparison
Welsh
Apache
1.5%
NO SCHOOLING COMPLETED
100.0/ 100
METRIC RATING
20th/ 347
METRIC RANK
2.1%
NO SCHOOLING COMPLETED
56.7/ 100
METRIC RATING
169th/ 347
METRIC RANK
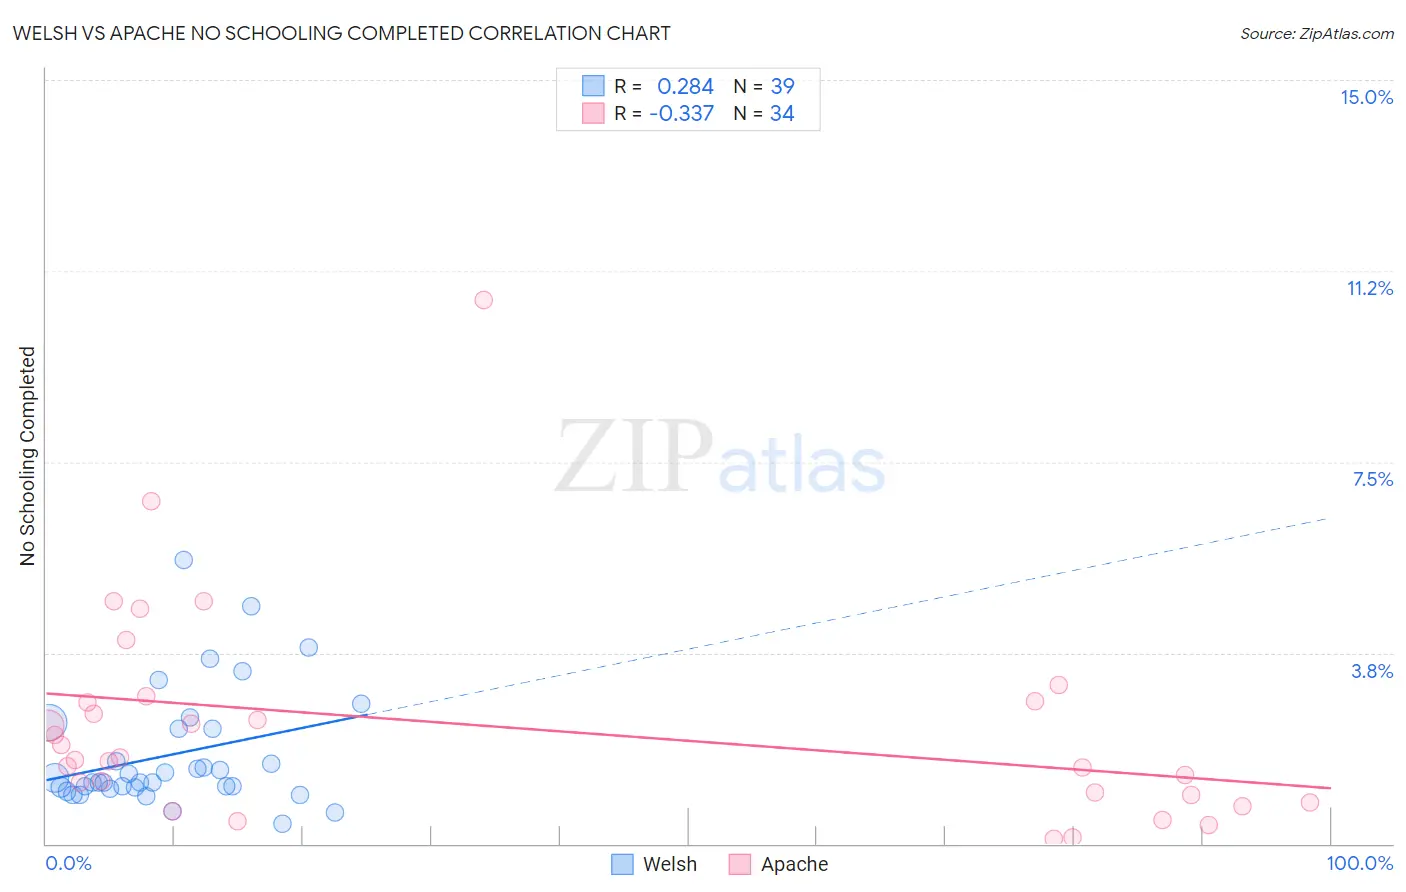
Welsh vs Apache No Schooling Completed Correlation Chart
The statistical analysis conducted on geographies consisting of 514,712,087 people shows a weak positive correlation between the proportion of Welsh and percentage of population with no schooling in the United States with a correlation coefficient (R) of 0.284 and weighted average of 1.5%. Similarly, the statistical analysis conducted on geographies consisting of 229,858,613 people shows a mild negative correlation between the proportion of Apache and percentage of population with no schooling in the United States with a correlation coefficient (R) of -0.337 and weighted average of 2.1%, a difference of 41.2%.
No Schooling Completed Correlation Summary
| Measurement | Welsh | Apache |
| Minimum | 0.40% | 0.098% |
| Maximum | 5.6% | 10.7% |
| Range | 5.2% | 10.6% |
| Mean | 1.8% | 2.3% |
| Median | 1.2% | 1.7% |
| Interquartile 25% (IQ1) | 1.1% | 0.95% |
| Interquartile 75% (IQ3) | 2.2% | 2.8% |
| Interquartile Range (IQR) | 1.1% | 1.9% |
| Standard Deviation (Sample) | 1.2% | 2.1% |
| Standard Deviation (Population) | 1.1% | 2.1% |
Similar Demographics by No Schooling Completed
Demographics Similar to Welsh by No Schooling Completed
In terms of no schooling completed, the demographic groups most similar to Welsh are Alaskan Athabascan (1.5%, a difference of 0.13%), Danish (1.5%, a difference of 0.23%), Chinese (1.5%, a difference of 0.37%), Alaska Native (1.5%, a difference of 0.46%), and Croatian (1.5%, a difference of 0.53%).
| Demographics | Rating | Rank | No Schooling Completed |
| Poles | 100.0 /100 | #13 | Exceptional 1.4% |
| Scotch-Irish | 100.0 /100 | #14 | Exceptional 1.5% |
| Tlingit-Haida | 100.0 /100 | #15 | Exceptional 1.5% |
| Finns | 100.0 /100 | #16 | Exceptional 1.5% |
| Croatians | 100.0 /100 | #17 | Exceptional 1.5% |
| Danes | 100.0 /100 | #18 | Exceptional 1.5% |
| Alaskan Athabascans | 100.0 /100 | #19 | Exceptional 1.5% |
| Welsh | 100.0 /100 | #20 | Exceptional 1.5% |
| Chinese | 100.0 /100 | #21 | Exceptional 1.5% |
| Alaska Natives | 100.0 /100 | #22 | Exceptional 1.5% |
| Europeans | 100.0 /100 | #23 | Exceptional 1.5% |
| Pennsylvania Germans | 100.0 /100 | #24 | Exceptional 1.5% |
| French | 100.0 /100 | #25 | Exceptional 1.5% |
| Czechs | 100.0 /100 | #26 | Exceptional 1.5% |
| Scandinavians | 100.0 /100 | #27 | Exceptional 1.5% |
Demographics Similar to Apache by No Schooling Completed
In terms of no schooling completed, the demographic groups most similar to Apache are Argentinean (2.1%, a difference of 0.090%), Immigrants from Poland (2.1%, a difference of 0.20%), Cheyenne (2.1%, a difference of 0.27%), Egyptian (2.1%, a difference of 0.35%), and Dutch West Indian (2.1%, a difference of 0.46%).
| Demographics | Rating | Rank | No Schooling Completed |
| Immigrants | Brazil | 63.8 /100 | #162 | Good 2.1% |
| Albanians | 62.2 /100 | #163 | Good 2.1% |
| Comanche | 60.7 /100 | #164 | Good 2.1% |
| Brazilians | 60.2 /100 | #165 | Good 2.1% |
| Dutch West Indians | 59.9 /100 | #166 | Average 2.1% |
| Egyptians | 59.2 /100 | #167 | Average 2.1% |
| Cheyenne | 58.6 /100 | #168 | Average 2.1% |
| Apache | 56.7 /100 | #169 | Average 2.1% |
| Argentineans | 56.0 /100 | #170 | Average 2.1% |
| Immigrants | Poland | 55.2 /100 | #171 | Average 2.1% |
| Immigrants | Argentina | 52.7 /100 | #172 | Average 2.1% |
| Immigrants | Belarus | 51.8 /100 | #173 | Average 2.1% |
| Immigrants | Micronesia | 50.0 /100 | #174 | Average 2.1% |
| Arabs | 46.4 /100 | #175 | Average 2.1% |
| Panamanians | 45.2 /100 | #176 | Average 2.1% |