Kiowa vs Apache No Schooling Completed
COMPARE
Kiowa
Apache
No Schooling Completed
No Schooling Completed Comparison
Kiowa
Apache
1.6%
NO SCHOOLING COMPLETED
99.8/ 100
METRIC RATING
58th/ 347
METRIC RANK
2.1%
NO SCHOOLING COMPLETED
56.7/ 100
METRIC RATING
169th/ 347
METRIC RANK
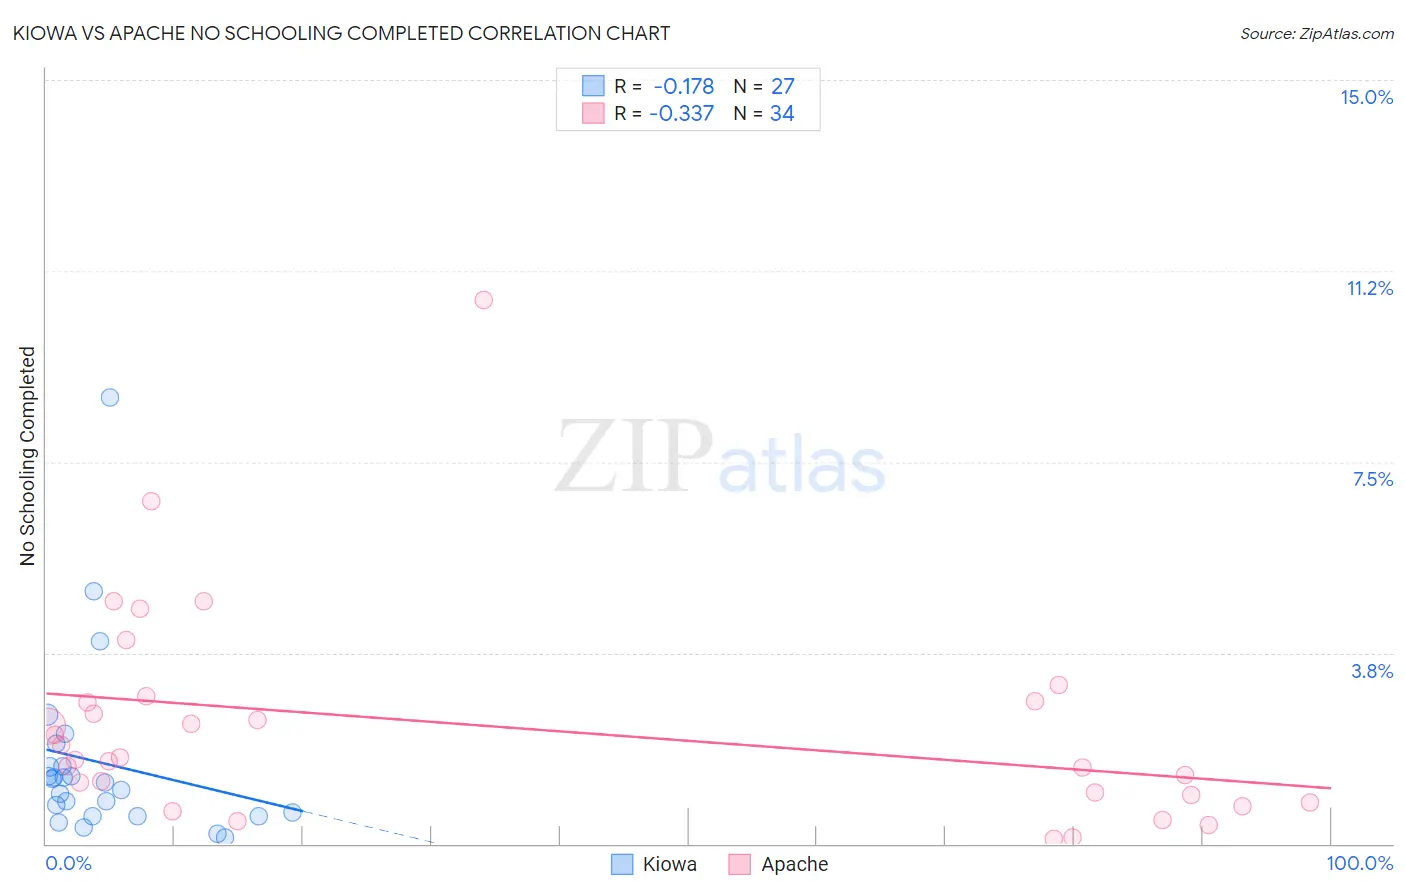
Kiowa vs Apache No Schooling Completed Correlation Chart
The statistical analysis conducted on geographies consisting of 55,891,433 people shows a poor negative correlation between the proportion of Kiowa and percentage of population with no schooling in the United States with a correlation coefficient (R) of -0.178 and weighted average of 1.6%. Similarly, the statistical analysis conducted on geographies consisting of 229,858,613 people shows a mild negative correlation between the proportion of Apache and percentage of population with no schooling in the United States with a correlation coefficient (R) of -0.337 and weighted average of 2.1%, a difference of 25.7%.
No Schooling Completed Correlation Summary
| Measurement | Kiowa | Apache |
| Minimum | 0.13% | 0.098% |
| Maximum | 8.8% | 10.7% |
| Range | 8.6% | 10.6% |
| Mean | 1.6% | 2.3% |
| Median | 1.2% | 1.7% |
| Interquartile 25% (IQ1) | 0.55% | 0.95% |
| Interquartile 75% (IQ3) | 1.5% | 2.8% |
| Interquartile Range (IQR) | 0.99% | 1.9% |
| Standard Deviation (Sample) | 1.8% | 2.1% |
| Standard Deviation (Population) | 1.8% | 2.1% |
Similar Demographics by No Schooling Completed
Demographics Similar to Kiowa by No Schooling Completed
In terms of no schooling completed, the demographic groups most similar to Kiowa are Slavic (1.7%, a difference of 0.070%), Austrian (1.6%, a difference of 0.16%), American (1.7%, a difference of 0.19%), Immigrants from North America (1.6%, a difference of 0.46%), and Greek (1.6%, a difference of 0.47%).
| Demographics | Rating | Rank | No Schooling Completed |
| Chippewa | 99.8 /100 | #51 | Exceptional 1.6% |
| Immigrants | Canada | 99.8 /100 | #52 | Exceptional 1.6% |
| Creek | 99.8 /100 | #53 | Exceptional 1.6% |
| Crow | 99.8 /100 | #54 | Exceptional 1.6% |
| Greeks | 99.8 /100 | #55 | Exceptional 1.6% |
| Immigrants | North America | 99.8 /100 | #56 | Exceptional 1.6% |
| Austrians | 99.8 /100 | #57 | Exceptional 1.6% |
| Kiowa | 99.8 /100 | #58 | Exceptional 1.6% |
| Slavs | 99.8 /100 | #59 | Exceptional 1.7% |
| Americans | 99.8 /100 | #60 | Exceptional 1.7% |
| Tsimshian | 99.8 /100 | #61 | Exceptional 1.7% |
| Immigrants | Northern Europe | 99.8 /100 | #62 | Exceptional 1.7% |
| Russians | 99.8 /100 | #63 | Exceptional 1.7% |
| New Zealanders | 99.7 /100 | #64 | Exceptional 1.7% |
| Serbians | 99.7 /100 | #65 | Exceptional 1.7% |
Demographics Similar to Apache by No Schooling Completed
In terms of no schooling completed, the demographic groups most similar to Apache are Argentinean (2.1%, a difference of 0.090%), Immigrants from Poland (2.1%, a difference of 0.20%), Cheyenne (2.1%, a difference of 0.27%), Egyptian (2.1%, a difference of 0.35%), and Dutch West Indian (2.1%, a difference of 0.46%).
| Demographics | Rating | Rank | No Schooling Completed |
| Immigrants | Brazil | 63.8 /100 | #162 | Good 2.1% |
| Albanians | 62.2 /100 | #163 | Good 2.1% |
| Comanche | 60.7 /100 | #164 | Good 2.1% |
| Brazilians | 60.2 /100 | #165 | Good 2.1% |
| Dutch West Indians | 59.9 /100 | #166 | Average 2.1% |
| Egyptians | 59.2 /100 | #167 | Average 2.1% |
| Cheyenne | 58.6 /100 | #168 | Average 2.1% |
| Apache | 56.7 /100 | #169 | Average 2.1% |
| Argentineans | 56.0 /100 | #170 | Average 2.1% |
| Immigrants | Poland | 55.2 /100 | #171 | Average 2.1% |
| Immigrants | Argentina | 52.7 /100 | #172 | Average 2.1% |
| Immigrants | Belarus | 51.8 /100 | #173 | Average 2.1% |
| Immigrants | Micronesia | 50.0 /100 | #174 | Average 2.1% |
| Arabs | 46.4 /100 | #175 | Average 2.1% |
| Panamanians | 45.2 /100 | #176 | Average 2.1% |