Kenyan vs Apache No Schooling Completed
COMPARE
Kenyan
Apache
No Schooling Completed
No Schooling Completed Comparison
Kenyans
Apache
2.0%
NO SCHOOLING COMPLETED
65.7/ 100
METRIC RATING
160th/ 347
METRIC RANK
2.1%
NO SCHOOLING COMPLETED
56.7/ 100
METRIC RATING
169th/ 347
METRIC RANK
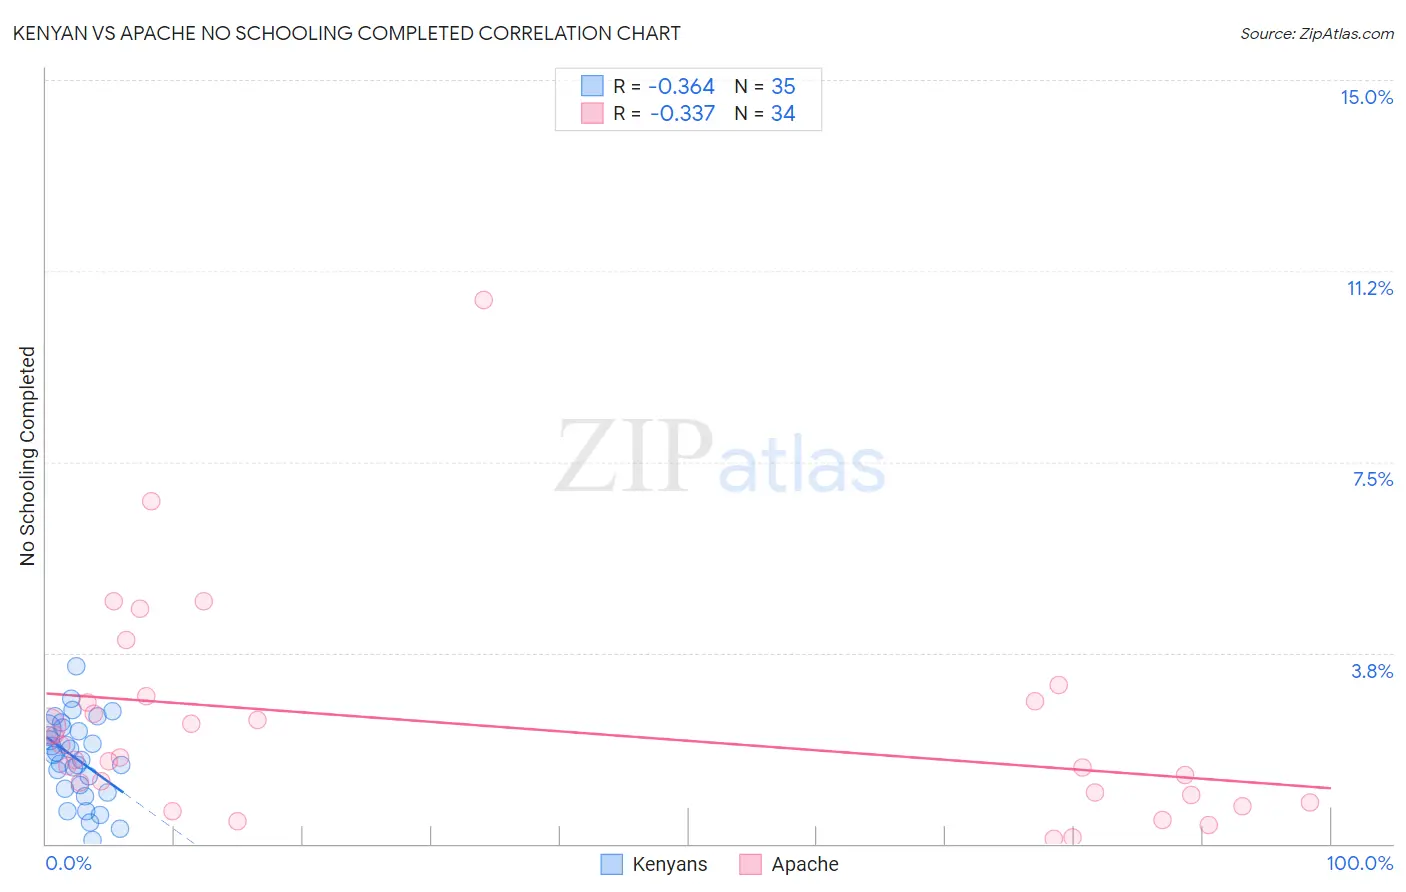
Kenyan vs Apache No Schooling Completed Correlation Chart
The statistical analysis conducted on geographies consisting of 167,616,465 people shows a mild negative correlation between the proportion of Kenyans and percentage of population with no schooling in the United States with a correlation coefficient (R) of -0.364 and weighted average of 2.0%. Similarly, the statistical analysis conducted on geographies consisting of 229,858,613 people shows a mild negative correlation between the proportion of Apache and percentage of population with no schooling in the United States with a correlation coefficient (R) of -0.337 and weighted average of 2.1%, a difference of 1.3%.
No Schooling Completed Correlation Summary
| Measurement | Kenyan | Apache |
| Minimum | 0.067% | 0.098% |
| Maximum | 3.5% | 10.7% |
| Range | 3.4% | 10.6% |
| Mean | 1.7% | 2.3% |
| Median | 1.8% | 1.7% |
| Interquartile 25% (IQ1) | 1.1% | 0.95% |
| Interquartile 75% (IQ3) | 2.3% | 2.8% |
| Interquartile Range (IQR) | 1.2% | 1.9% |
| Standard Deviation (Sample) | 0.79% | 2.1% |
| Standard Deviation (Population) | 0.78% | 2.1% |
Demographics Similar to Kenyans and Apache by No Schooling Completed
In terms of no schooling completed, the demographic groups most similar to Kenyans are Immigrants from Spain (2.0%, a difference of 0.12%), Immigrants from Korea (2.0%, a difference of 0.16%), Ugandan (2.0%, a difference of 0.17%), Immigrants from Sri Lanka (2.0%, a difference of 0.20%), and Chilean (2.0%, a difference of 0.24%). Similarly, the demographic groups most similar to Apache are Argentinean (2.1%, a difference of 0.090%), Immigrants from Poland (2.1%, a difference of 0.20%), Cheyenne (2.1%, a difference of 0.27%), Egyptian (2.1%, a difference of 0.35%), and Dutch West Indian (2.1%, a difference of 0.46%).
| Demographics | Rating | Rank | No Schooling Completed |
| Immigrants | Venezuela | 68.5 /100 | #154 | Good 2.0% |
| Immigrants | Russia | 67.6 /100 | #155 | Good 2.0% |
| Chileans | 67.2 /100 | #156 | Good 2.0% |
| Immigrants | Sri Lanka | 67.0 /100 | #157 | Good 2.0% |
| Immigrants | Korea | 66.7 /100 | #158 | Good 2.0% |
| Immigrants | Spain | 66.4 /100 | #159 | Good 2.0% |
| Kenyans | 65.7 /100 | #160 | Good 2.0% |
| Ugandans | 64.6 /100 | #161 | Good 2.0% |
| Immigrants | Brazil | 63.8 /100 | #162 | Good 2.1% |
| Albanians | 62.2 /100 | #163 | Good 2.1% |
| Comanche | 60.7 /100 | #164 | Good 2.1% |
| Brazilians | 60.2 /100 | #165 | Good 2.1% |
| Dutch West Indians | 59.9 /100 | #166 | Average 2.1% |
| Egyptians | 59.2 /100 | #167 | Average 2.1% |
| Cheyenne | 58.6 /100 | #168 | Average 2.1% |
| Apache | 56.7 /100 | #169 | Average 2.1% |
| Argentineans | 56.0 /100 | #170 | Average 2.1% |
| Immigrants | Poland | 55.2 /100 | #171 | Average 2.1% |
| Immigrants | Argentina | 52.7 /100 | #172 | Average 2.1% |
| Immigrants | Belarus | 51.8 /100 | #173 | Average 2.1% |
| Immigrants | Micronesia | 50.0 /100 | #174 | Average 2.1% |