Dominican vs Jordanian GED/Equivalency
COMPARE
Dominican
Jordanian
GED/Equivalency
GED/Equivalency Comparison
Dominicans
Jordanians
79.1%
GED/EQUIVALENCY
0.0/ 100
METRIC RATING
329th/ 347
METRIC RANK
87.2%
GED/EQUIVALENCY
96.1/ 100
METRIC RATING
103rd/ 347
METRIC RANK
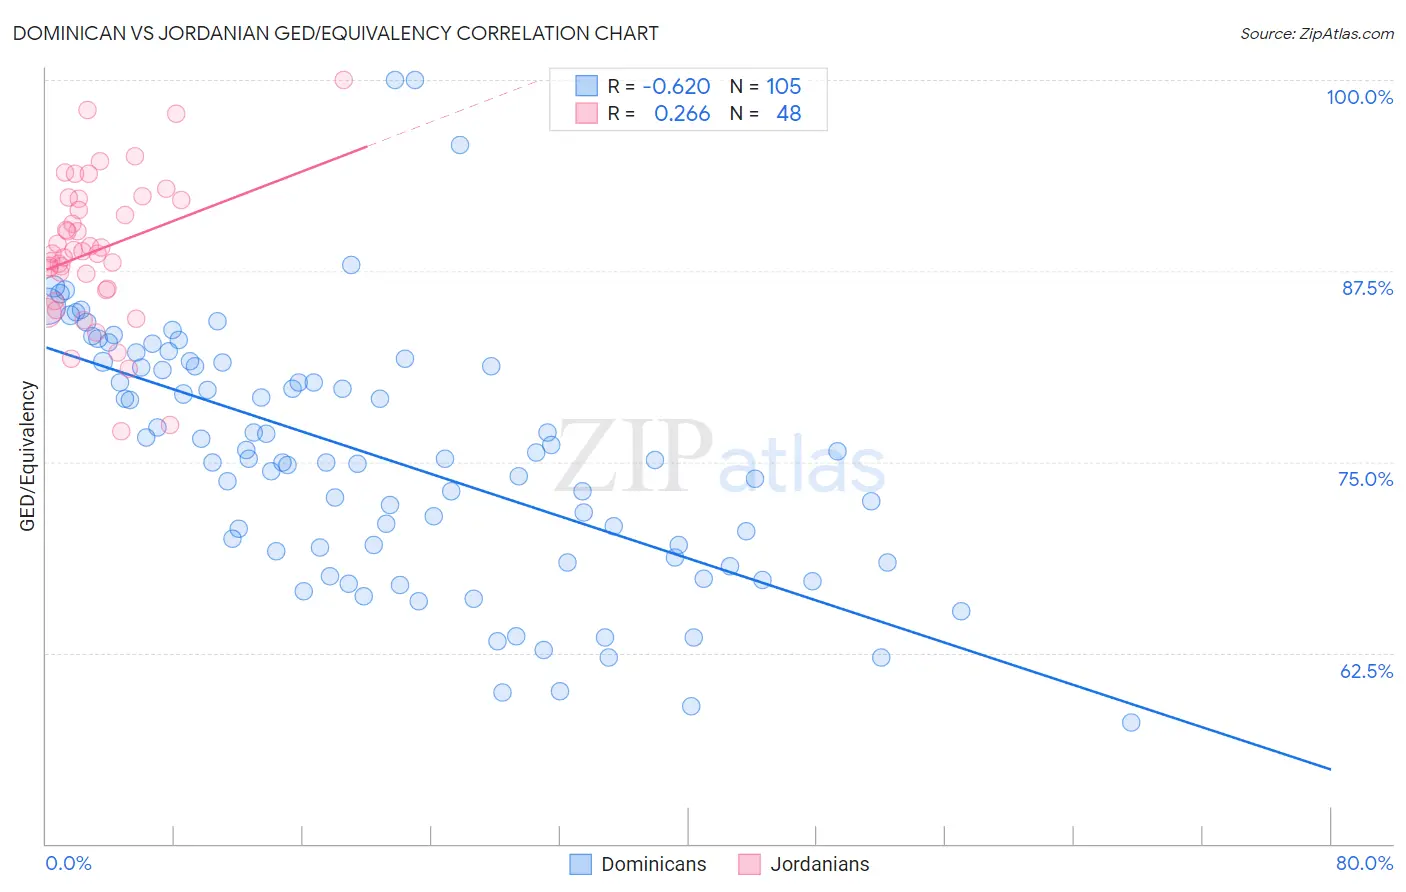
Dominican vs Jordanian GED/Equivalency Correlation Chart
The statistical analysis conducted on geographies consisting of 355,143,187 people shows a significant negative correlation between the proportion of Dominicans and percentage of population with at least ged/equivalency education in the United States with a correlation coefficient (R) of -0.620 and weighted average of 79.1%. Similarly, the statistical analysis conducted on geographies consisting of 166,422,962 people shows a weak positive correlation between the proportion of Jordanians and percentage of population with at least ged/equivalency education in the United States with a correlation coefficient (R) of 0.266 and weighted average of 87.2%, a difference of 10.3%.
GED/Equivalency Correlation Summary
| Measurement | Dominican | Jordanian |
| Minimum | 58.0% | 77.0% |
| Maximum | 100.0% | 100.0% |
| Range | 42.0% | 23.0% |
| Mean | 75.3% | 88.8% |
| Median | 75.2% | 88.7% |
| Interquartile 25% (IQ1) | 69.0% | 86.3% |
| Interquartile 75% (IQ3) | 81.4% | 92.2% |
| Interquartile Range (IQR) | 12.5% | 6.0% |
| Standard Deviation (Sample) | 8.3% | 4.8% |
| Standard Deviation (Population) | 8.3% | 4.8% |
Similar Demographics by GED/Equivalency
Demographics Similar to Dominicans by GED/Equivalency
In terms of ged/equivalency, the demographic groups most similar to Dominicans are Hispanic or Latino (79.1%, a difference of 0.050%), Central American (79.2%, a difference of 0.15%), Immigrants from Cabo Verde (78.9%, a difference of 0.16%), Yuman (79.2%, a difference of 0.17%), and Honduran (79.3%, a difference of 0.27%).
| Demographics | Rating | Rank | GED/Equivalency |
| Lumbee | 0.0 /100 | #322 | Tragic 80.0% |
| Immigrants | Nicaragua | 0.0 /100 | #323 | Tragic 79.9% |
| Mexican American Indians | 0.0 /100 | #324 | Tragic 79.4% |
| Hondurans | 0.0 /100 | #325 | Tragic 79.3% |
| Yuman | 0.0 /100 | #326 | Tragic 79.2% |
| Central Americans | 0.0 /100 | #327 | Tragic 79.2% |
| Hispanics or Latinos | 0.0 /100 | #328 | Tragic 79.1% |
| Dominicans | 0.0 /100 | #329 | Tragic 79.1% |
| Immigrants | Cabo Verde | 0.0 /100 | #330 | Tragic 78.9% |
| Immigrants | Honduras | 0.0 /100 | #331 | Tragic 78.7% |
| Immigrants | Azores | 0.0 /100 | #332 | Tragic 78.7% |
| Salvadorans | 0.0 /100 | #333 | Tragic 78.6% |
| Guatemalans | 0.0 /100 | #334 | Tragic 78.5% |
| Immigrants | Latin America | 0.0 /100 | #335 | Tragic 78.5% |
| Immigrants | Dominican Republic | 0.0 /100 | #336 | Tragic 78.0% |
Demographics Similar to Jordanians by GED/Equivalency
In terms of ged/equivalency, the demographic groups most similar to Jordanians are Lebanese (87.2%, a difference of 0.010%), Immigrants from Hungary (87.2%, a difference of 0.010%), Indian (Asian) (87.1%, a difference of 0.020%), Immigrants from Zimbabwe (87.1%, a difference of 0.040%), and Icelander (87.1%, a difference of 0.050%).
| Demographics | Rating | Rank | GED/Equivalency |
| Czechoslovakians | 97.6 /100 | #96 | Exceptional 87.4% |
| Immigrants | Western Europe | 97.3 /100 | #97 | Exceptional 87.3% |
| Immigrants | Croatia | 96.9 /100 | #98 | Exceptional 87.3% |
| Immigrants | Belarus | 96.9 /100 | #99 | Exceptional 87.3% |
| Palestinians | 96.8 /100 | #100 | Exceptional 87.3% |
| Syrians | 96.6 /100 | #101 | Exceptional 87.2% |
| Lebanese | 96.2 /100 | #102 | Exceptional 87.2% |
| Jordanians | 96.1 /100 | #103 | Exceptional 87.2% |
| Immigrants | Hungary | 96.0 /100 | #104 | Exceptional 87.2% |
| Indians (Asian) | 95.9 /100 | #105 | Exceptional 87.1% |
| Immigrants | Zimbabwe | 95.8 /100 | #106 | Exceptional 87.1% |
| Icelanders | 95.7 /100 | #107 | Exceptional 87.1% |
| Canadians | 95.6 /100 | #108 | Exceptional 87.1% |
| Immigrants | Eastern Europe | 95.5 /100 | #109 | Exceptional 87.1% |
| Egyptians | 95.3 /100 | #110 | Exceptional 87.1% |