Syrian vs Immigrants from Nepal 9th Grade
COMPARE
Syrian
Immigrants from Nepal
9th Grade
9th Grade Comparison
Syrians
Immigrants from Nepal
95.5%
9TH GRADE
97.4/ 100
METRIC RATING
104th/ 347
METRIC RANK
94.8%
9TH GRADE
39.7/ 100
METRIC RATING
183rd/ 347
METRIC RANK
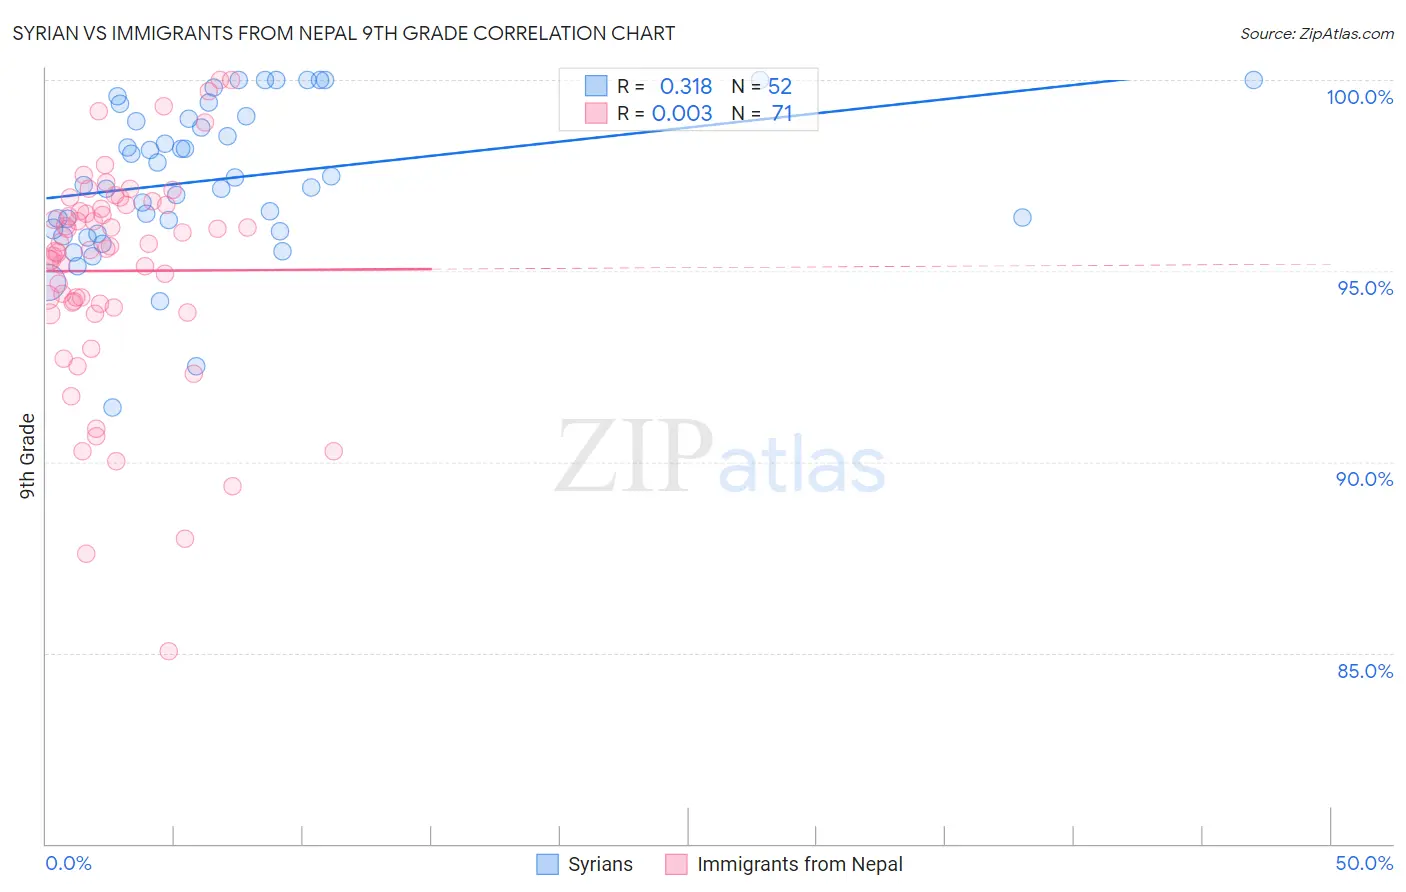
Syrian vs Immigrants from Nepal 9th Grade Correlation Chart
The statistical analysis conducted on geographies consisting of 266,305,988 people shows a mild positive correlation between the proportion of Syrians and percentage of population with at least 9th grade education in the United States with a correlation coefficient (R) of 0.318 and weighted average of 95.5%. Similarly, the statistical analysis conducted on geographies consisting of 186,636,986 people shows no correlation between the proportion of Immigrants from Nepal and percentage of population with at least 9th grade education in the United States with a correlation coefficient (R) of 0.003 and weighted average of 94.8%, a difference of 0.74%.
9th Grade Correlation Summary
| Measurement | Syrian | Immigrants from Nepal |
| Minimum | 91.4% | 85.0% |
| Maximum | 100.0% | 100.0% |
| Range | 8.6% | 15.0% |
| Mean | 97.4% | 95.0% |
| Median | 97.3% | 95.6% |
| Interquartile 25% (IQ1) | 96.1% | 94.0% |
| Interquartile 75% (IQ3) | 99.0% | 96.7% |
| Interquartile Range (IQR) | 2.9% | 2.7% |
| Standard Deviation (Sample) | 2.0% | 2.9% |
| Standard Deviation (Population) | 2.0% | 2.9% |
Similar Demographics by 9th Grade
Demographics Similar to Syrians by 9th Grade
In terms of 9th grade, the demographic groups most similar to Syrians are Immigrants from France (95.5%, a difference of 0.0%), Potawatomi (95.5%, a difference of 0.020%), Immigrants from Norway (95.5%, a difference of 0.020%), Immigrants from Switzerland (95.5%, a difference of 0.030%), and Immigrants from Zimbabwe (95.5%, a difference of 0.030%).
| Demographics | Rating | Rank | 9th Grade |
| Delaware | 98.4 /100 | #97 | Exceptional 95.6% |
| Immigrants | Japan | 98.4 /100 | #98 | Exceptional 95.6% |
| Menominee | 98.3 /100 | #99 | Exceptional 95.6% |
| Lebanese | 98.1 /100 | #100 | Exceptional 95.6% |
| Immigrants | Moldova | 97.9 /100 | #101 | Exceptional 95.5% |
| Immigrants | Switzerland | 97.7 /100 | #102 | Exceptional 95.5% |
| Potawatomi | 97.7 /100 | #103 | Exceptional 95.5% |
| Syrians | 97.4 /100 | #104 | Exceptional 95.5% |
| Immigrants | France | 97.4 /100 | #105 | Exceptional 95.5% |
| Immigrants | Norway | 97.1 /100 | #106 | Exceptional 95.5% |
| Immigrants | Zimbabwe | 96.9 /100 | #107 | Exceptional 95.5% |
| Chickasaw | 96.8 /100 | #108 | Exceptional 95.5% |
| Osage | 96.8 /100 | #109 | Exceptional 95.5% |
| Immigrants | Bulgaria | 96.7 /100 | #110 | Exceptional 95.5% |
| Cherokee | 96.3 /100 | #111 | Exceptional 95.4% |
Demographics Similar to Immigrants from Nepal by 9th Grade
In terms of 9th grade, the demographic groups most similar to Immigrants from Nepal are Sierra Leonean (94.8%, a difference of 0.020%), Seminole (94.8%, a difference of 0.020%), Argentinean (94.8%, a difference of 0.020%), Liberian (94.8%, a difference of 0.020%), and Hopi (94.8%, a difference of 0.020%).
| Demographics | Rating | Rank | 9th Grade |
| Immigrants | Spain | 49.1 /100 | #176 | Average 94.9% |
| Immigrants | Iraq | 47.8 /100 | #177 | Average 94.9% |
| Immigrants | Poland | 46.7 /100 | #178 | Average 94.9% |
| Immigrants | Venezuela | 46.5 /100 | #179 | Average 94.9% |
| Immigrants | Uganda | 43.1 /100 | #180 | Average 94.8% |
| Sierra Leoneans | 42.7 /100 | #181 | Average 94.8% |
| Seminole | 42.5 /100 | #182 | Average 94.8% |
| Immigrants | Nepal | 39.7 /100 | #183 | Fair 94.8% |
| Argentineans | 37.6 /100 | #184 | Fair 94.8% |
| Liberians | 37.4 /100 | #185 | Fair 94.8% |
| Hopi | 37.1 /100 | #186 | Fair 94.8% |
| Guamanians/Chamorros | 35.5 /100 | #187 | Fair 94.8% |
| Immigrants | Albania | 34.5 /100 | #188 | Fair 94.8% |
| Immigrants | Argentina | 34.4 /100 | #189 | Fair 94.8% |
| Sudanese | 32.7 /100 | #190 | Fair 94.7% |