Immigrants from Panama vs Polish No Schooling Completed
COMPARE
Immigrants from Panama
Polish
No Schooling Completed
No Schooling Completed Comparison
Immigrants from Panama
Poles
2.3%
NO SCHOOLING COMPLETED
8.8/ 100
METRIC RATING
211th/ 347
METRIC RANK
1.4%
NO SCHOOLING COMPLETED
100.0/ 100
METRIC RATING
13th/ 347
METRIC RANK
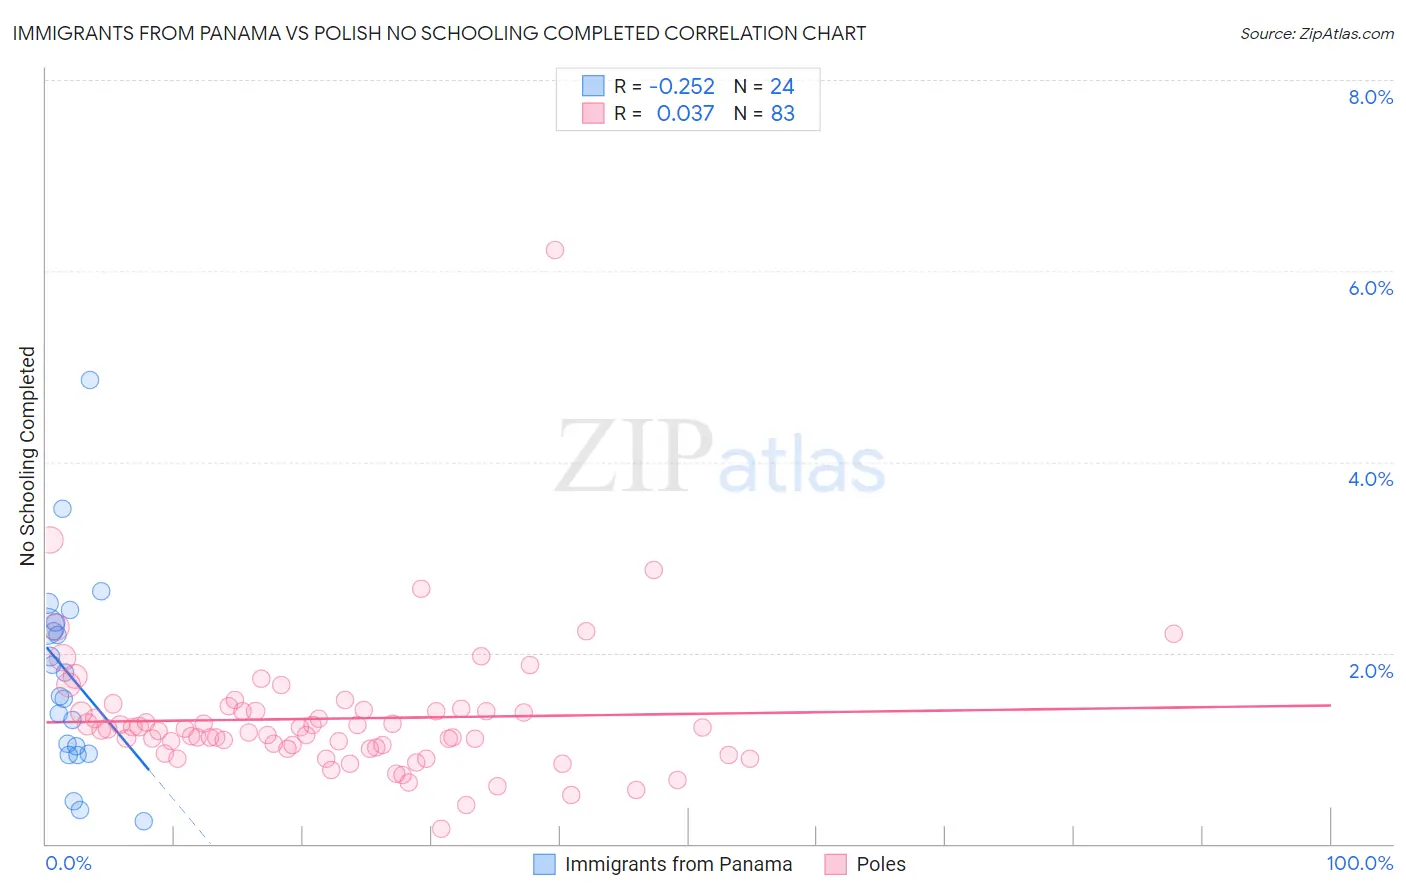
Immigrants from Panama vs Polish No Schooling Completed Correlation Chart
The statistical analysis conducted on geographies consisting of 220,555,519 people shows a weak negative correlation between the proportion of Immigrants from Panama and percentage of population with no schooling in the United States with a correlation coefficient (R) of -0.252 and weighted average of 2.3%. Similarly, the statistical analysis conducted on geographies consisting of 543,036,846 people shows no correlation between the proportion of Poles and percentage of population with no schooling in the United States with a correlation coefficient (R) of 0.037 and weighted average of 1.4%, a difference of 56.9%.
No Schooling Completed Correlation Summary
| Measurement | Immigrants from Panama | Polish |
| Minimum | 0.23% | 0.16% |
| Maximum | 4.9% | 6.2% |
| Range | 4.6% | 6.1% |
| Mean | 1.8% | 1.3% |
| Median | 1.7% | 1.2% |
| Interquartile 25% (IQ1) | 0.98% | 1.00% |
| Interquartile 75% (IQ3) | 2.3% | 1.4% |
| Interquartile Range (IQR) | 1.3% | 0.39% |
| Standard Deviation (Sample) | 1.0% | 0.74% |
| Standard Deviation (Population) | 1.0% | 0.74% |
Similar Demographics by No Schooling Completed
Demographics Similar to Immigrants from Panama by No Schooling Completed
In terms of no schooling completed, the demographic groups most similar to Immigrants from Panama are Immigrants from Morocco (2.3%, a difference of 0.010%), Ute (2.3%, a difference of 0.20%), Samoan (2.3%, a difference of 0.24%), Native/Alaskan (2.2%, a difference of 0.45%), and Immigrants from Oceania (2.2%, a difference of 0.53%).
| Demographics | Rating | Rank | No Schooling Completed |
| Hopi | 12.9 /100 | #204 | Poor 2.2% |
| Immigrants | Bahamas | 11.6 /100 | #205 | Poor 2.2% |
| Bahamians | 11.6 /100 | #206 | Poor 2.2% |
| South American Indians | 11.0 /100 | #207 | Poor 2.2% |
| Uruguayans | 11.0 /100 | #208 | Poor 2.2% |
| Immigrants | Oceania | 10.2 /100 | #209 | Poor 2.2% |
| Natives/Alaskans | 10.0 /100 | #210 | Tragic 2.2% |
| Immigrants | Panama | 8.8 /100 | #211 | Tragic 2.3% |
| Immigrants | Morocco | 8.7 /100 | #212 | Tragic 2.3% |
| Ute | 8.2 /100 | #213 | Tragic 2.3% |
| Samoans | 8.2 /100 | #214 | Tragic 2.3% |
| Immigrants | Zaire | 7.2 /100 | #215 | Tragic 2.3% |
| Tongans | 6.8 /100 | #216 | Tragic 2.3% |
| Immigrants | Syria | 6.6 /100 | #217 | Tragic 2.3% |
| Immigrants | Nepal | 6.4 /100 | #218 | Tragic 2.3% |
Demographics Similar to Poles by No Schooling Completed
In terms of no schooling completed, the demographic groups most similar to Poles are Irish (1.4%, a difference of 0.030%), Lithuanian (1.4%, a difference of 0.050%), Dutch (1.4%, a difference of 0.89%), Scotch-Irish (1.5%, a difference of 0.94%), and Tlingit-Haida (1.5%, a difference of 1.0%).
| Demographics | Rating | Rank | No Schooling Completed |
| Carpatho Rusyns | 100.0 /100 | #6 | Exceptional 1.4% |
| English | 100.0 /100 | #7 | Exceptional 1.4% |
| Swedes | 100.0 /100 | #8 | Exceptional 1.4% |
| Scottish | 100.0 /100 | #9 | Exceptional 1.4% |
| Dutch | 100.0 /100 | #10 | Exceptional 1.4% |
| Lithuanians | 100.0 /100 | #11 | Exceptional 1.4% |
| Irish | 100.0 /100 | #12 | Exceptional 1.4% |
| Poles | 100.0 /100 | #13 | Exceptional 1.4% |
| Scotch-Irish | 100.0 /100 | #14 | Exceptional 1.5% |
| Tlingit-Haida | 100.0 /100 | #15 | Exceptional 1.5% |
| Finns | 100.0 /100 | #16 | Exceptional 1.5% |
| Croatians | 100.0 /100 | #17 | Exceptional 1.5% |
| Danes | 100.0 /100 | #18 | Exceptional 1.5% |
| Alaskan Athabascans | 100.0 /100 | #19 | Exceptional 1.5% |
| Welsh | 100.0 /100 | #20 | Exceptional 1.5% |