Swiss vs Immigrants from Hong Kong Unemployment Among Ages 45 to 54 years
COMPARE
Swiss
Immigrants from Hong Kong
Unemployment Among Ages 45 to 54 years
Unemployment Among Ages 45 to 54 years Comparison
Swiss
Immigrants from Hong Kong
4.1%
UNEMPLOYMENT AMONG AGES 45 TO 54 YEARS
100.0/ 100
METRIC RATING
19th/ 347
METRIC RANK
4.5%
UNEMPLOYMENT AMONG AGES 45 TO 54 YEARS
45.9/ 100
METRIC RATING
184th/ 347
METRIC RANK
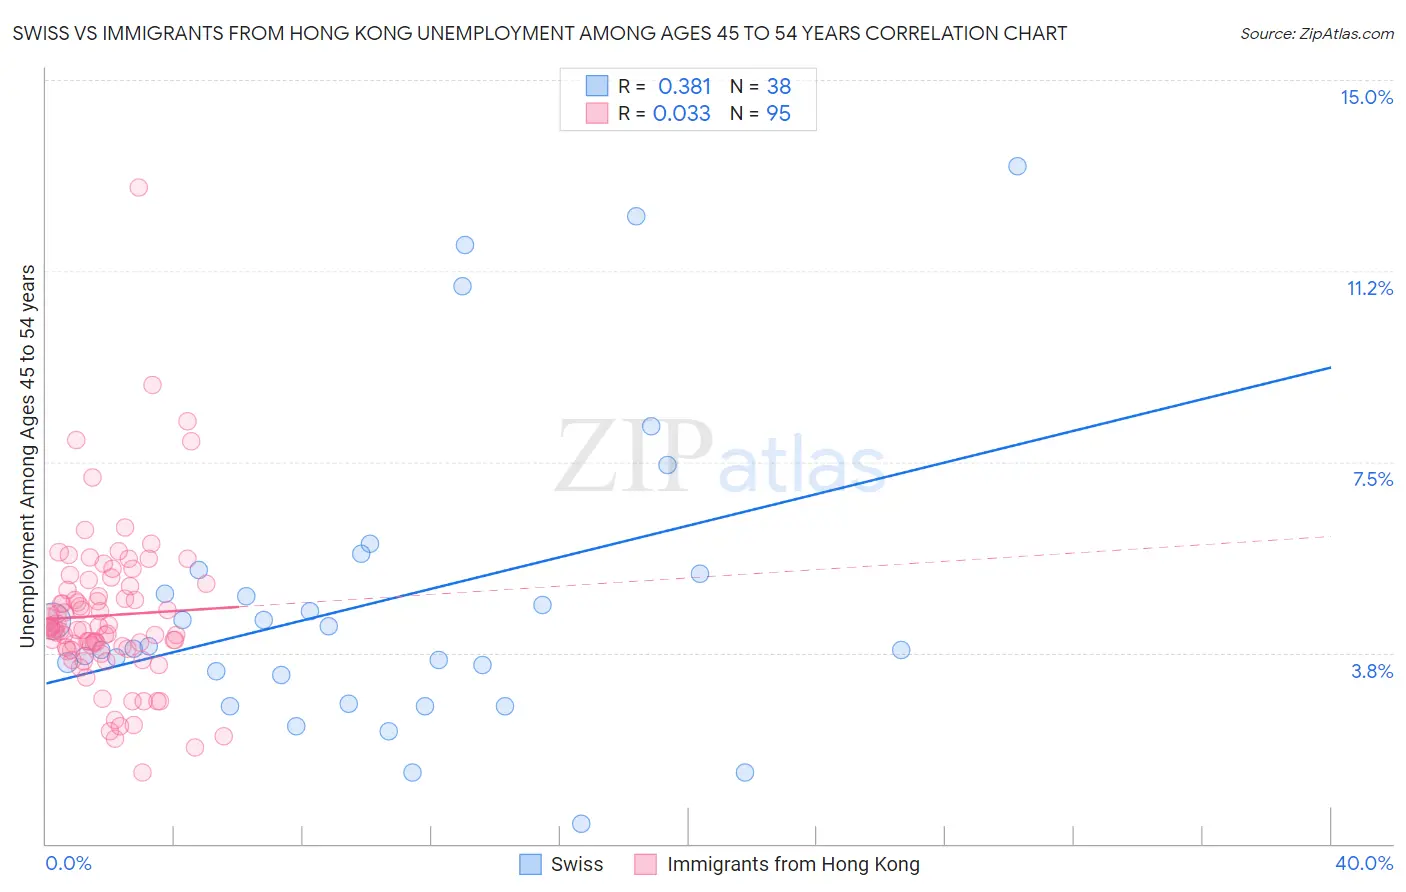
Swiss vs Immigrants from Hong Kong Unemployment Among Ages 45 to 54 years Correlation Chart
The statistical analysis conducted on geographies consisting of 442,560,941 people shows a mild positive correlation between the proportion of Swiss and unemployment rate among population between the ages 45 and 54 in the United States with a correlation coefficient (R) of 0.381 and weighted average of 4.1%. Similarly, the statistical analysis conducted on geographies consisting of 251,096,451 people shows no correlation between the proportion of Immigrants from Hong Kong and unemployment rate among population between the ages 45 and 54 in the United States with a correlation coefficient (R) of 0.033 and weighted average of 4.5%, a difference of 11.4%.
Unemployment Among Ages 45 to 54 years Correlation Summary
| Measurement | Swiss | Immigrants from Hong Kong |
| Minimum | 0.40% | 1.4% |
| Maximum | 13.3% | 12.9% |
| Range | 12.9% | 11.5% |
| Mean | 4.8% | 4.5% |
| Median | 3.9% | 4.2% |
| Interquartile 25% (IQ1) | 3.3% | 3.8% |
| Interquartile 75% (IQ3) | 5.3% | 5.1% |
| Interquartile Range (IQR) | 2.0% | 1.2% |
| Standard Deviation (Sample) | 3.0% | 1.6% |
| Standard Deviation (Population) | 2.9% | 1.6% |
Similar Demographics by Unemployment Among Ages 45 to 54 years
Demographics Similar to Swiss by Unemployment Among Ages 45 to 54 years
In terms of unemployment among ages 45 to 54 years, the demographic groups most similar to Swiss are English (4.1%, a difference of 0.16%), German (4.1%, a difference of 0.29%), Tongan (4.1%, a difference of 0.31%), European (4.1%, a difference of 0.49%), and Yugoslavian (4.1%, a difference of 0.58%).
| Demographics | Rating | Rank | Unemployment Among Ages 45 to 54 years |
| Swedes | 100.0 /100 | #12 | Exceptional 4.0% |
| Cubans | 100.0 /100 | #13 | Exceptional 4.0% |
| Immigrants | Bosnia and Herzegovina | 100.0 /100 | #14 | Exceptional 4.0% |
| Immigrants | Bolivia | 100.0 /100 | #15 | Exceptional 4.0% |
| Thais | 100.0 /100 | #16 | Exceptional 4.0% |
| Tongans | 100.0 /100 | #17 | Exceptional 4.1% |
| Germans | 100.0 /100 | #18 | Exceptional 4.1% |
| Swiss | 100.0 /100 | #19 | Exceptional 4.1% |
| English | 100.0 /100 | #20 | Exceptional 4.1% |
| Europeans | 100.0 /100 | #21 | Exceptional 4.1% |
| Yugoslavians | 100.0 /100 | #22 | Exceptional 4.1% |
| Bulgarians | 100.0 /100 | #23 | Exceptional 4.1% |
| Carpatho Rusyns | 100.0 /100 | #24 | Exceptional 4.1% |
| Bolivians | 99.9 /100 | #25 | Exceptional 4.1% |
| Scottish | 99.9 /100 | #26 | Exceptional 4.1% |
Demographics Similar to Immigrants from Hong Kong by Unemployment Among Ages 45 to 54 years
In terms of unemployment among ages 45 to 54 years, the demographic groups most similar to Immigrants from Hong Kong are Immigrants from China (4.5%, a difference of 0.040%), Sierra Leonean (4.5%, a difference of 0.040%), Immigrants from Poland (4.5%, a difference of 0.050%), Malaysian (4.5%, a difference of 0.070%), and Immigrants from Russia (4.5%, a difference of 0.11%).
| Demographics | Rating | Rank | Unemployment Among Ages 45 to 54 years |
| Immigrants | Northern Africa | 49.0 /100 | #177 | Average 4.5% |
| Immigrants | Australia | 48.5 /100 | #178 | Average 4.5% |
| Immigrants | Russia | 48.2 /100 | #179 | Average 4.5% |
| Malaysians | 47.5 /100 | #180 | Average 4.5% |
| Immigrants | Poland | 47.0 /100 | #181 | Average 4.5% |
| Immigrants | China | 46.7 /100 | #182 | Average 4.5% |
| Sierra Leoneans | 46.7 /100 | #183 | Average 4.5% |
| Immigrants | Hong Kong | 45.9 /100 | #184 | Average 4.5% |
| Immigrants | Philippines | 41.0 /100 | #185 | Average 4.5% |
| Hawaiians | 39.1 /100 | #186 | Fair 4.5% |
| Immigrants | Ukraine | 36.8 /100 | #187 | Fair 4.5% |
| Immigrants | Sierra Leone | 36.3 /100 | #188 | Fair 4.6% |
| Immigrants | Laos | 35.7 /100 | #189 | Fair 4.6% |
| Immigrants | Serbia | 34.8 /100 | #190 | Fair 4.6% |
| Immigrants | Uruguay | 34.4 /100 | #191 | Fair 4.6% |