Swiss vs Immigrants from Spain 10th Grade
COMPARE
Swiss
Immigrants from Spain
10th Grade
10th Grade Comparison
Swiss
Immigrants from Spain
94.7%
10TH GRADE
99.1/ 100
METRIC RATING
82nd/ 347
METRIC RANK
93.8%
10TH GRADE
55.9/ 100
METRIC RATING
169th/ 347
METRIC RANK
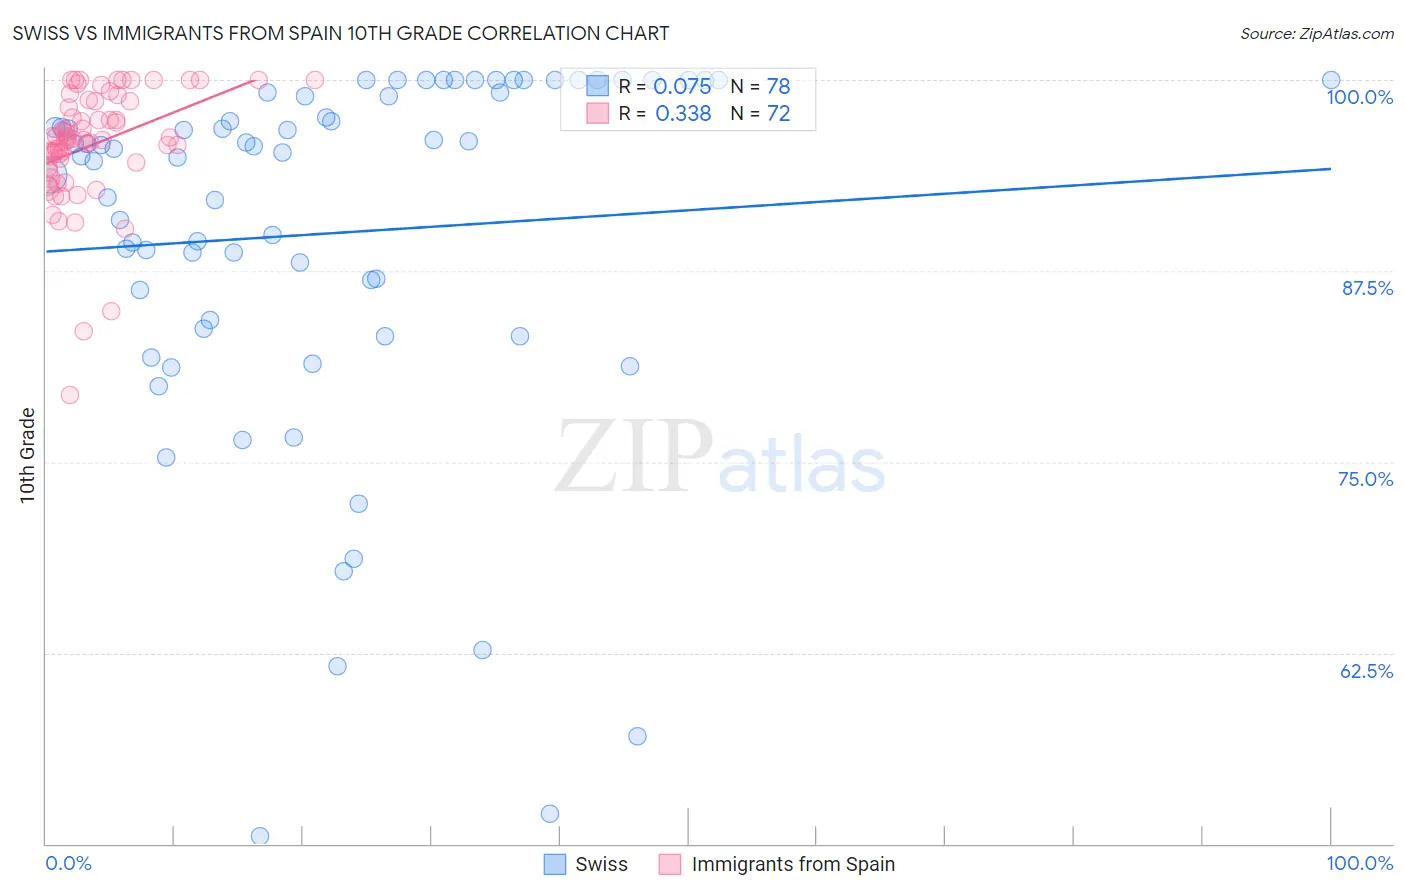
Swiss vs Immigrants from Spain 10th Grade Correlation Chart
The statistical analysis conducted on geographies consisting of 465,022,572 people shows a slight positive correlation between the proportion of Swiss and percentage of population with at least 10th grade education in the United States with a correlation coefficient (R) of 0.075 and weighted average of 94.7%. Similarly, the statistical analysis conducted on geographies consisting of 239,682,725 people shows a mild positive correlation between the proportion of Immigrants from Spain and percentage of population with at least 10th grade education in the United States with a correlation coefficient (R) of 0.338 and weighted average of 93.8%, a difference of 1.0%.
10th Grade Correlation Summary
| Measurement | Swiss | Immigrants from Spain |
| Minimum | 50.5% | 79.4% |
| Maximum | 100.0% | 100.0% |
| Range | 49.5% | 20.6% |
| Mean | 90.0% | 95.7% |
| Median | 95.4% | 96.1% |
| Interquartile 25% (IQ1) | 84.3% | 94.4% |
| Interquartile 75% (IQ3) | 99.2% | 98.6% |
| Interquartile Range (IQR) | 14.9% | 4.2% |
| Standard Deviation (Sample) | 12.0% | 3.8% |
| Standard Deviation (Population) | 11.9% | 3.8% |
Similar Demographics by 10th Grade
Demographics Similar to Swiss by 10th Grade
In terms of 10th grade, the demographic groups most similar to Swiss are Immigrants from Western Europe (94.7%, a difference of 0.010%), Icelander (94.7%, a difference of 0.010%), Crow (94.7%, a difference of 0.020%), Puget Sound Salish (94.7%, a difference of 0.020%), and Immigrants from Denmark (94.7%, a difference of 0.030%).
| Demographics | Rating | Rank | 10th Grade |
| Okinawans | 99.5 /100 | #75 | Exceptional 94.8% |
| Romanians | 99.5 /100 | #76 | Exceptional 94.8% |
| Immigrants | South Africa | 99.5 /100 | #77 | Exceptional 94.8% |
| Filipinos | 99.3 /100 | #78 | Exceptional 94.8% |
| Immigrants | Czechoslovakia | 99.2 /100 | #79 | Exceptional 94.7% |
| Immigrants | Denmark | 99.2 /100 | #80 | Exceptional 94.7% |
| Immigrants | Latvia | 99.2 /100 | #81 | Exceptional 94.7% |
| Swiss | 99.1 /100 | #82 | Exceptional 94.7% |
| Immigrants | Western Europe | 99.1 /100 | #83 | Exceptional 94.7% |
| Icelanders | 99.1 /100 | #84 | Exceptional 94.7% |
| Crow | 99.0 /100 | #85 | Exceptional 94.7% |
| Puget Sound Salish | 99.0 /100 | #86 | Exceptional 94.7% |
| Immigrants | Saudi Arabia | 99.0 /100 | #87 | Exceptional 94.7% |
| Immigrants | Japan | 99.0 /100 | #88 | Exceptional 94.7% |
| Immigrants | Moldova | 98.9 /100 | #89 | Exceptional 94.7% |
Demographics Similar to Immigrants from Spain by 10th Grade
In terms of 10th grade, the demographic groups most similar to Immigrants from Spain are Immigrants from Venezuela (93.8%, a difference of 0.020%), Alsatian (93.8%, a difference of 0.030%), Immigrants from Albania (93.8%, a difference of 0.030%), French American Indian (93.7%, a difference of 0.050%), and Spaniard (93.7%, a difference of 0.050%).
| Demographics | Rating | Rank | 10th Grade |
| Immigrants | Poland | 69.6 /100 | #162 | Good 93.9% |
| Venezuelans | 69.5 /100 | #163 | Good 93.9% |
| Iraqis | 68.1 /100 | #164 | Good 93.9% |
| Brazilians | 63.6 /100 | #165 | Good 93.8% |
| Immigrants | Iraq | 63.0 /100 | #166 | Good 93.8% |
| Immigrants | Egypt | 62.3 /100 | #167 | Good 93.8% |
| Alsatians | 59.4 /100 | #168 | Average 93.8% |
| Immigrants | Spain | 55.9 /100 | #169 | Average 93.8% |
| Immigrants | Venezuela | 53.9 /100 | #170 | Average 93.8% |
| Immigrants | Albania | 52.4 /100 | #171 | Average 93.8% |
| French American Indians | 50.9 /100 | #172 | Average 93.7% |
| Spaniards | 50.3 /100 | #173 | Average 93.7% |
| Argentineans | 50.0 /100 | #174 | Average 93.7% |
| Immigrants | Nepal | 49.6 /100 | #175 | Average 93.7% |
| Immigrants | Argentina | 47.1 /100 | #176 | Average 93.7% |