Swedish vs Yaqui Married-couple Households
COMPARE
Swedish
Yaqui
Married-couple Households
Married-couple Households Comparison
Swedes
Yaqui
49.7%
MARRIED-COUPLE HOUSEHOLDS
99.9/ 100
METRIC RATING
16th/ 347
METRIC RANK
44.5%
MARRIED-COUPLE HOUSEHOLDS
1.2/ 100
METRIC RATING
236th/ 347
METRIC RANK
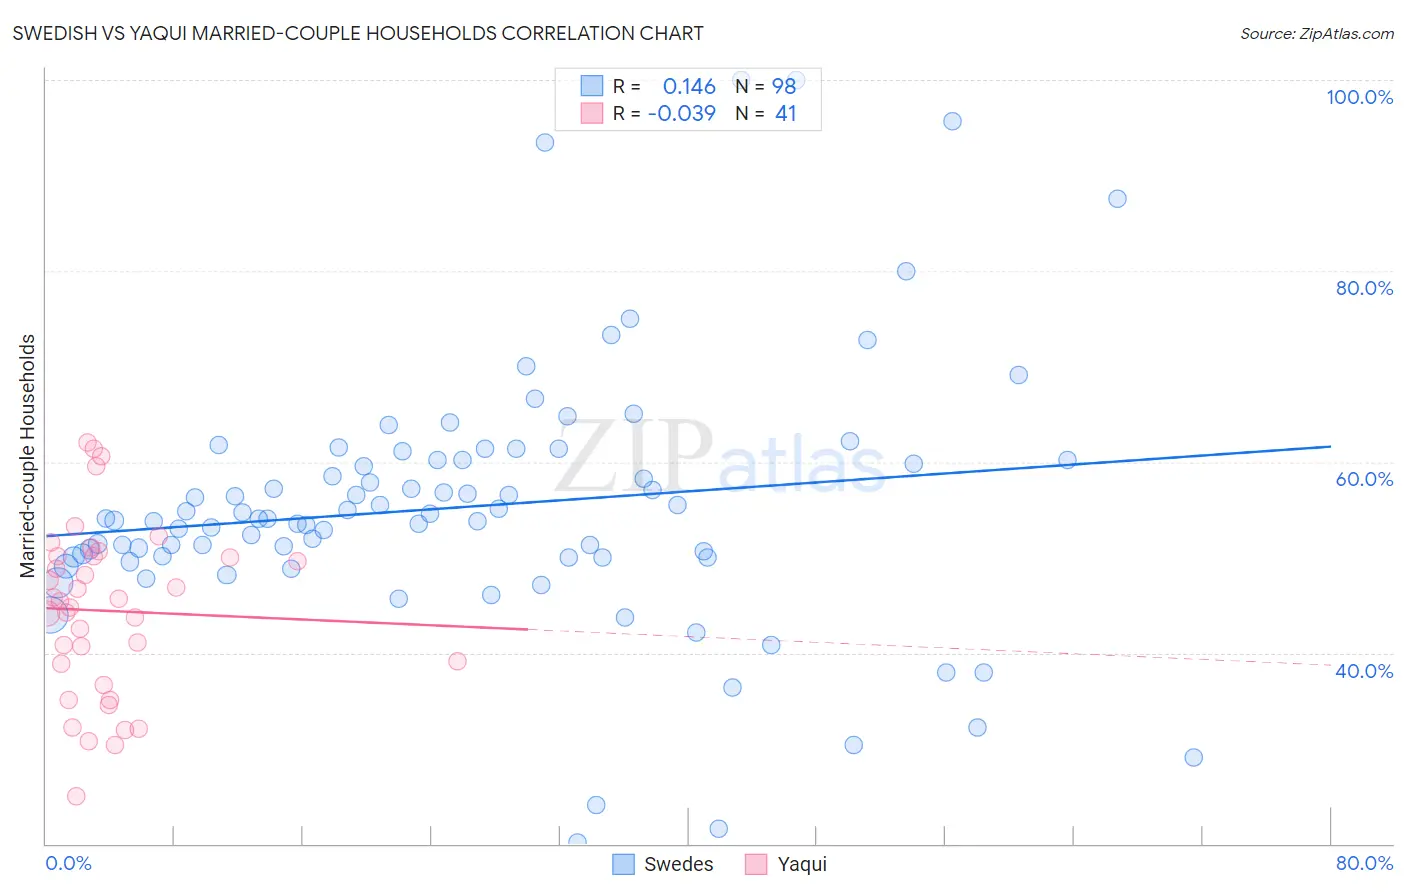
Swedish vs Yaqui Married-couple Households Correlation Chart
The statistical analysis conducted on geographies consisting of 538,743,335 people shows a poor positive correlation between the proportion of Swedes and percentage of married-couple family households in the United States with a correlation coefficient (R) of 0.146 and weighted average of 49.7%. Similarly, the statistical analysis conducted on geographies consisting of 107,720,236 people shows no correlation between the proportion of Yaqui and percentage of married-couple family households in the United States with a correlation coefficient (R) of -0.039 and weighted average of 44.5%, a difference of 11.7%.
Married-couple Households Correlation Summary
| Measurement | Swedish | Yaqui |
| Minimum | 20.2% | 25.0% |
| Maximum | 100.0% | 62.1% |
| Range | 79.8% | 37.1% |
| Mean | 55.3% | 44.4% |
| Median | 54.0% | 45.4% |
| Interquartile 25% (IQ1) | 50.0% | 37.8% |
| Interquartile 75% (IQ3) | 60.2% | 50.2% |
| Interquartile Range (IQR) | 10.2% | 12.4% |
| Standard Deviation (Sample) | 13.9% | 9.0% |
| Standard Deviation (Population) | 13.8% | 8.9% |
Similar Demographics by Married-couple Households
Demographics Similar to Swedes by Married-couple Households
In terms of married-couple households, the demographic groups most similar to Swedes are Korean (49.7%, a difference of 0.030%), Immigrants from Hong Kong (49.6%, a difference of 0.15%), English (49.6%, a difference of 0.16%), Burmese (49.8%, a difference of 0.18%), and Immigrants from Korea (49.9%, a difference of 0.30%).
| Demographics | Rating | Rank | Married-couple Households |
| Pennsylvania Germans | 100.0 /100 | #9 | Exceptional 50.4% |
| Chinese | 100.0 /100 | #10 | Exceptional 50.4% |
| Immigrants | Pakistan | 100.0 /100 | #11 | Exceptional 50.1% |
| Swiss | 100.0 /100 | #12 | Exceptional 49.9% |
| Immigrants | Korea | 100.0 /100 | #13 | Exceptional 49.9% |
| Burmese | 100.0 /100 | #14 | Exceptional 49.8% |
| Koreans | 99.9 /100 | #15 | Exceptional 49.7% |
| Swedes | 99.9 /100 | #16 | Exceptional 49.7% |
| Immigrants | Hong Kong | 99.9 /100 | #17 | Exceptional 49.6% |
| English | 99.9 /100 | #18 | Exceptional 49.6% |
| Europeans | 99.9 /100 | #19 | Exceptional 49.6% |
| Scandinavians | 99.9 /100 | #20 | Exceptional 49.6% |
| Norwegians | 99.9 /100 | #21 | Exceptional 49.5% |
| Asians | 99.9 /100 | #22 | Exceptional 49.5% |
| Dutch | 99.9 /100 | #23 | Exceptional 49.5% |
Demographics Similar to Yaqui by Married-couple Households
In terms of married-couple households, the demographic groups most similar to Yaqui are Immigrants from Nicaragua (44.5%, a difference of 0.0%), Comanche (44.5%, a difference of 0.030%), Immigrants from Panama (44.6%, a difference of 0.080%), Immigrants from Uruguay (44.5%, a difference of 0.080%), and Spanish American (44.5%, a difference of 0.10%).
| Demographics | Rating | Rank | Married-couple Households |
| Immigrants | Latin America | 1.6 /100 | #229 | Tragic 44.7% |
| Soviet Union | 1.6 /100 | #230 | Tragic 44.6% |
| Houma | 1.5 /100 | #231 | Tragic 44.6% |
| Marshallese | 1.5 /100 | #232 | Tragic 44.6% |
| Immigrants | Uganda | 1.5 /100 | #233 | Tragic 44.6% |
| Immigrants | Panama | 1.3 /100 | #234 | Tragic 44.6% |
| Immigrants | Nicaragua | 1.2 /100 | #235 | Tragic 44.5% |
| Yaqui | 1.2 /100 | #236 | Tragic 44.5% |
| Comanche | 1.2 /100 | #237 | Tragic 44.5% |
| Immigrants | Uruguay | 1.1 /100 | #238 | Tragic 44.5% |
| Spanish Americans | 1.1 /100 | #239 | Tragic 44.5% |
| Ute | 1.0 /100 | #240 | Tragic 44.4% |
| Immigrants | Bosnia and Herzegovina | 1.0 /100 | #241 | Tragic 44.4% |
| Immigrants | Albania | 1.0 /100 | #242 | Tragic 44.4% |
| Immigrants | Saudi Arabia | 0.9 /100 | #243 | Tragic 44.4% |