Swedish vs Indonesian 11th Grade
COMPARE
Swedish
Indonesian
11th Grade
11th Grade Comparison
Swedes
Indonesians
94.9%
11TH GRADE
100.0/ 100
METRIC RATING
2nd/ 347
METRIC RANK
90.3%
11TH GRADE
0.0/ 100
METRIC RATING
290th/ 347
METRIC RANK
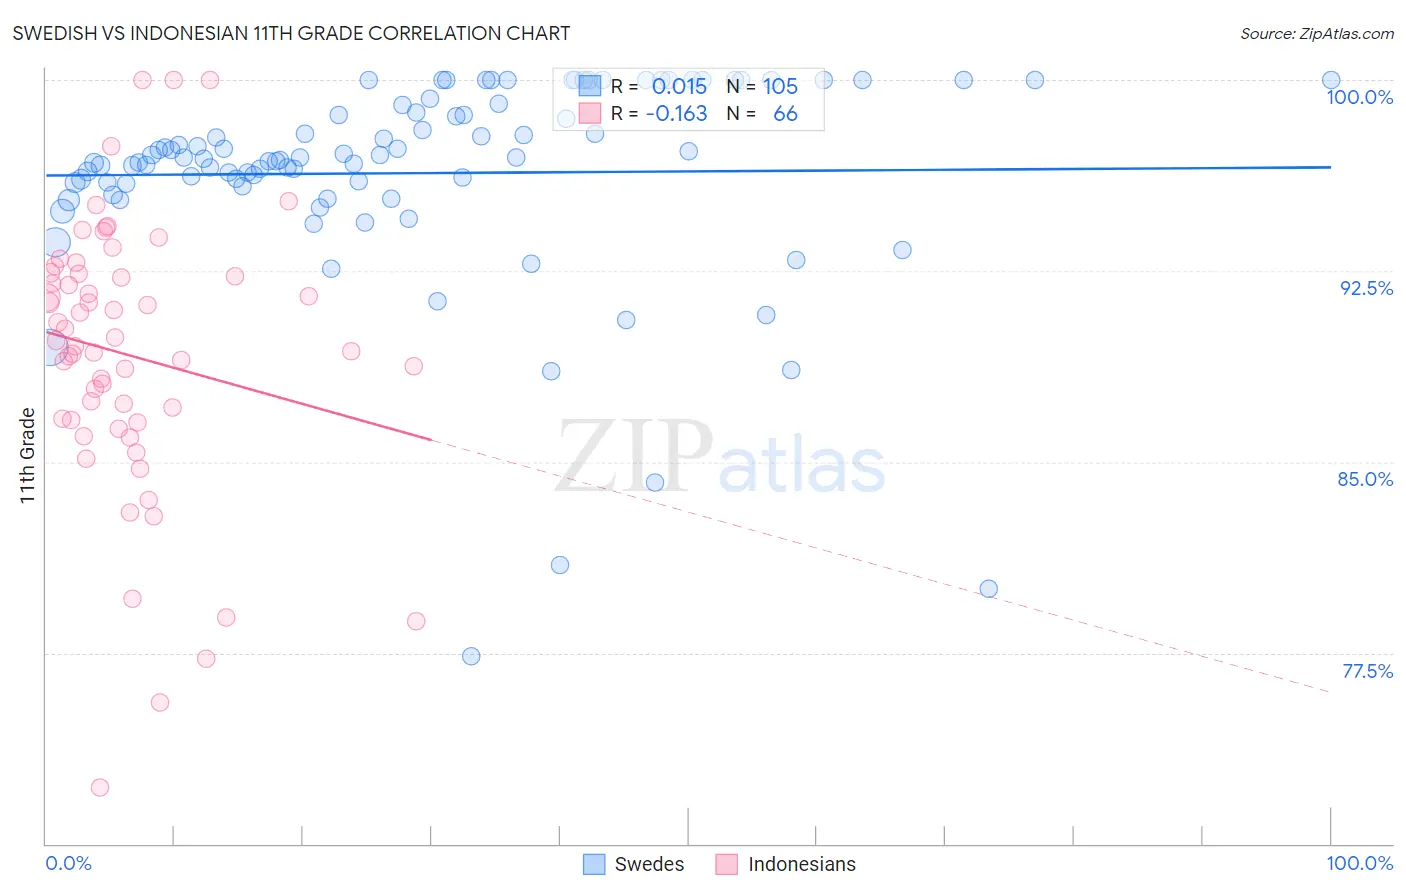
Swedish vs Indonesian 11th Grade Correlation Chart
The statistical analysis conducted on geographies consisting of 539,231,897 people shows no correlation between the proportion of Swedes and percentage of population with at least 11th grade education in the United States with a correlation coefficient (R) of 0.015 and weighted average of 94.9%. Similarly, the statistical analysis conducted on geographies consisting of 162,727,113 people shows a poor negative correlation between the proportion of Indonesians and percentage of population with at least 11th grade education in the United States with a correlation coefficient (R) of -0.163 and weighted average of 90.3%, a difference of 5.1%.
11th Grade Correlation Summary
| Measurement | Swedish | Indonesian |
| Minimum | 77.4% | 72.2% |
| Maximum | 100.0% | 100.0% |
| Range | 22.6% | 27.8% |
| Mean | 96.3% | 89.2% |
| Median | 96.9% | 89.7% |
| Interquartile 25% (IQ1) | 95.9% | 86.6% |
| Interquartile 75% (IQ3) | 99.0% | 92.4% |
| Interquartile Range (IQR) | 3.1% | 5.8% |
| Standard Deviation (Sample) | 4.1% | 5.4% |
| Standard Deviation (Population) | 4.1% | 5.4% |
Similar Demographics by 11th Grade
Demographics Similar to Swedes by 11th Grade
In terms of 11th grade, the demographic groups most similar to Swedes are Slovene (94.9%, a difference of 0.010%), Slovak (94.9%, a difference of 0.040%), Carpatho Rusyn (94.8%, a difference of 0.10%), Lithuanian (94.8%, a difference of 0.14%), and Polish (94.8%, a difference of 0.20%).
| Demographics | Rating | Rank | 11th Grade |
| Norwegians | 100.0 /100 | #1 | Exceptional 95.2% |
| Swedes | 100.0 /100 | #2 | Exceptional 94.9% |
| Slovenes | 100.0 /100 | #3 | Exceptional 94.9% |
| Slovaks | 100.0 /100 | #4 | Exceptional 94.9% |
| Carpatho Rusyns | 100.0 /100 | #5 | Exceptional 94.8% |
| Lithuanians | 100.0 /100 | #6 | Exceptional 94.8% |
| Poles | 100.0 /100 | #7 | Exceptional 94.8% |
| Croatians | 100.0 /100 | #8 | Exceptional 94.7% |
| Danes | 100.0 /100 | #9 | Exceptional 94.7% |
| Finns | 100.0 /100 | #10 | Exceptional 94.7% |
| Germans | 100.0 /100 | #11 | Exceptional 94.7% |
| Latvians | 100.0 /100 | #12 | Exceptional 94.7% |
| Chinese | 100.0 /100 | #13 | Exceptional 94.6% |
| Eastern Europeans | 100.0 /100 | #14 | Exceptional 94.6% |
| Bulgarians | 100.0 /100 | #15 | Exceptional 94.5% |
Demographics Similar to Indonesians by 11th Grade
In terms of 11th grade, the demographic groups most similar to Indonesians are British West Indian (90.3%, a difference of 0.020%), Haitian (90.3%, a difference of 0.040%), Pennsylvania German (90.3%, a difference of 0.050%), Apache (90.4%, a difference of 0.070%), and Cuban (90.2%, a difference of 0.070%).
| Demographics | Rating | Rank | 11th Grade |
| Immigrants | Barbados | 0.0 /100 | #283 | Tragic 90.7% |
| Immigrants | Laos | 0.0 /100 | #284 | Tragic 90.5% |
| Immigrants | Burma/Myanmar | 0.0 /100 | #285 | Tragic 90.4% |
| Immigrants | West Indies | 0.0 /100 | #286 | Tragic 90.4% |
| Apache | 0.0 /100 | #287 | Tragic 90.4% |
| Pennsylvania Germans | 0.0 /100 | #288 | Tragic 90.3% |
| British West Indians | 0.0 /100 | #289 | Tragic 90.3% |
| Indonesians | 0.0 /100 | #290 | Tragic 90.3% |
| Haitians | 0.0 /100 | #291 | Tragic 90.3% |
| Cubans | 0.0 /100 | #292 | Tragic 90.2% |
| Natives/Alaskans | 0.0 /100 | #293 | Tragic 90.2% |
| Immigrants | Grenada | 0.0 /100 | #294 | Tragic 90.1% |
| Immigrants | Vietnam | 0.0 /100 | #295 | Tragic 90.0% |
| Fijians | 0.0 /100 | #296 | Tragic 90.0% |
| Navajo | 0.0 /100 | #297 | Tragic 90.0% |