Immigrants from Kenya vs Navajo 11th Grade
COMPARE
Immigrants from Kenya
Navajo
11th Grade
11th Grade Comparison
Immigrants from Kenya
Navajo
92.8%
11TH GRADE
78.7/ 100
METRIC RATING
147th/ 347
METRIC RANK
90.0%
11TH GRADE
0.0/ 100
METRIC RATING
297th/ 347
METRIC RANK
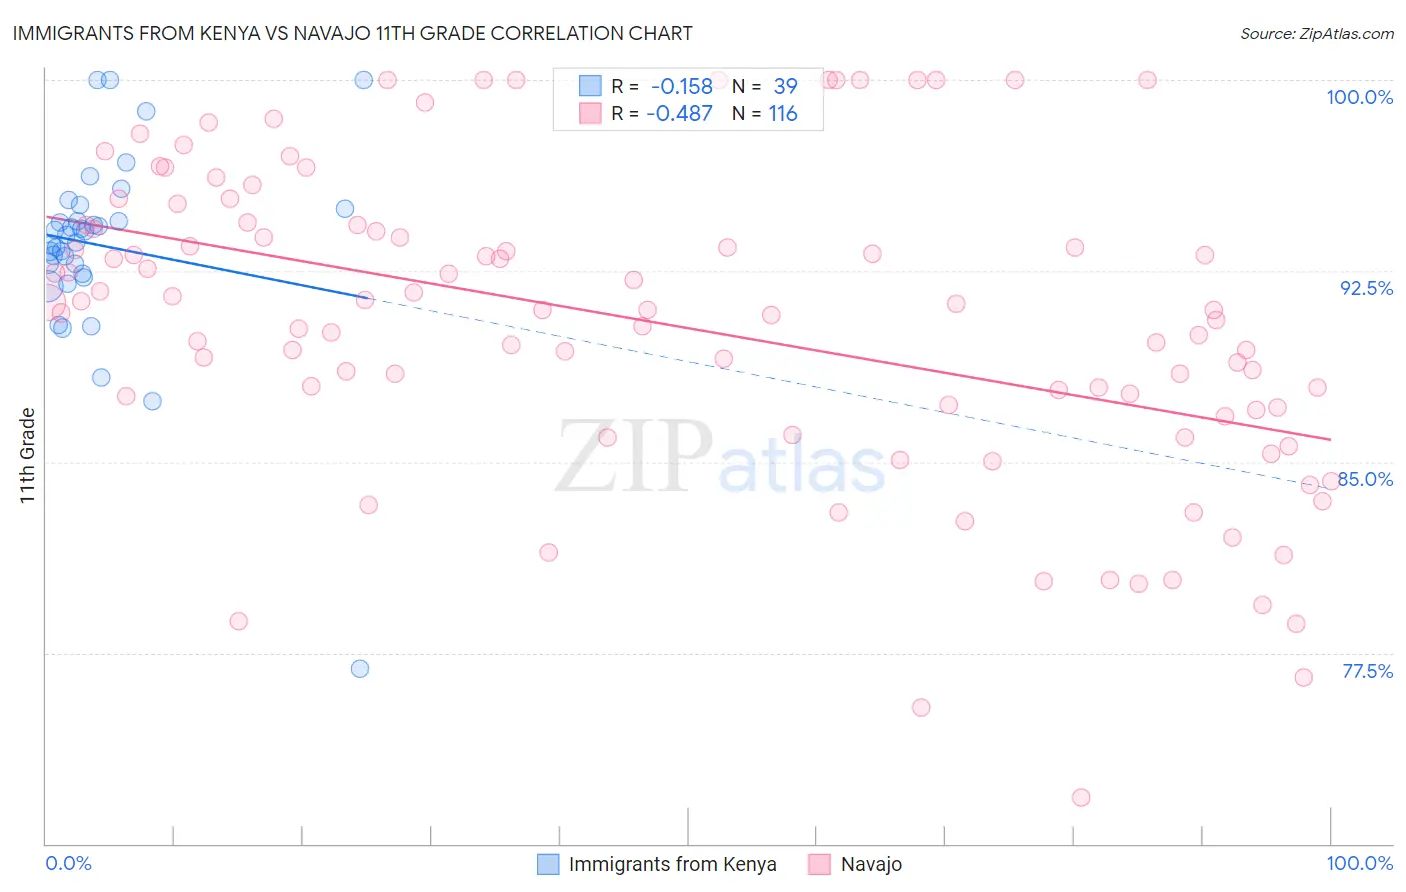
Immigrants from Kenya vs Navajo 11th Grade Correlation Chart
The statistical analysis conducted on geographies consisting of 218,076,690 people shows a poor negative correlation between the proportion of Immigrants from Kenya and percentage of population with at least 11th grade education in the United States with a correlation coefficient (R) of -0.158 and weighted average of 92.8%. Similarly, the statistical analysis conducted on geographies consisting of 224,872,858 people shows a moderate negative correlation between the proportion of Navajo and percentage of population with at least 11th grade education in the United States with a correlation coefficient (R) of -0.487 and weighted average of 90.0%, a difference of 3.1%.
11th Grade Correlation Summary
| Measurement | Immigrants from Kenya | Navajo |
| Minimum | 76.9% | 71.8% |
| Maximum | 100.0% | 100.0% |
| Range | 23.1% | 28.2% |
| Mean | 93.5% | 90.4% |
| Median | 93.9% | 91.0% |
| Interquartile 25% (IQ1) | 92.4% | 87.1% |
| Interquartile 75% (IQ3) | 95.0% | 94.2% |
| Interquartile Range (IQR) | 2.6% | 7.2% |
| Standard Deviation (Sample) | 3.9% | 6.1% |
| Standard Deviation (Population) | 3.8% | 6.1% |
Similar Demographics by 11th Grade
Demographics Similar to Immigrants from Kenya by 11th Grade
In terms of 11th grade, the demographic groups most similar to Immigrants from Kenya are Hmong (92.8%, a difference of 0.0%), Immigrants from Poland (92.8%, a difference of 0.0%), Pakistani (92.8%, a difference of 0.010%), Iroquois (92.8%, a difference of 0.010%), and Immigrants from Egypt (92.8%, a difference of 0.020%).
| Demographics | Rating | Rank | 11th Grade |
| Venezuelans | 83.4 /100 | #140 | Excellent 92.9% |
| Chileans | 83.0 /100 | #141 | Excellent 92.9% |
| Kenyans | 82.0 /100 | #142 | Excellent 92.9% |
| Ugandans | 81.4 /100 | #143 | Excellent 92.9% |
| Assyrians/Chaldeans/Syriacs | 80.5 /100 | #144 | Excellent 92.8% |
| Pakistanis | 79.6 /100 | #145 | Good 92.8% |
| Iroquois | 79.1 /100 | #146 | Good 92.8% |
| Immigrants | Kenya | 78.7 /100 | #147 | Good 92.8% |
| Hmong | 78.6 /100 | #148 | Good 92.8% |
| Immigrants | Poland | 78.5 /100 | #149 | Good 92.8% |
| Immigrants | Egypt | 77.5 /100 | #150 | Good 92.8% |
| Potawatomi | 74.3 /100 | #151 | Good 92.8% |
| Iraqis | 74.2 /100 | #152 | Good 92.8% |
| Brazilians | 73.9 /100 | #153 | Good 92.8% |
| Osage | 73.4 /100 | #154 | Good 92.7% |
Demographics Similar to Navajo by 11th Grade
In terms of 11th grade, the demographic groups most similar to Navajo are Fijian (90.0%, a difference of 0.040%), Immigrants from Vietnam (90.0%, a difference of 0.060%), Immigrants from Fiji (89.9%, a difference of 0.070%), Japanese (89.9%, a difference of 0.10%), and Immigrants from Haiti (89.9%, a difference of 0.11%).
| Demographics | Rating | Rank | 11th Grade |
| Indonesians | 0.0 /100 | #290 | Tragic 90.3% |
| Haitians | 0.0 /100 | #291 | Tragic 90.3% |
| Cubans | 0.0 /100 | #292 | Tragic 90.2% |
| Natives/Alaskans | 0.0 /100 | #293 | Tragic 90.2% |
| Immigrants | Grenada | 0.0 /100 | #294 | Tragic 90.1% |
| Immigrants | Vietnam | 0.0 /100 | #295 | Tragic 90.0% |
| Fijians | 0.0 /100 | #296 | Tragic 90.0% |
| Navajo | 0.0 /100 | #297 | Tragic 90.0% |
| Immigrants | Fiji | 0.0 /100 | #298 | Tragic 89.9% |
| Japanese | 0.0 /100 | #299 | Tragic 89.9% |
| Immigrants | Haiti | 0.0 /100 | #300 | Tragic 89.9% |
| Guyanese | 0.0 /100 | #301 | Tragic 89.9% |
| Immigrants | Guyana | 0.0 /100 | #302 | Tragic 89.7% |
| Immigrants | Immigrants | 0.0 /100 | #303 | Tragic 89.7% |
| Yuman | 0.0 /100 | #304 | Tragic 89.7% |