Immigrants from Bangladesh vs Navajo 11th Grade
COMPARE
Immigrants from Bangladesh
Navajo
11th Grade
11th Grade Comparison
Immigrants from Bangladesh
Navajo
89.5%
11TH GRADE
0.0/ 100
METRIC RATING
309th/ 347
METRIC RANK
90.0%
11TH GRADE
0.0/ 100
METRIC RATING
297th/ 347
METRIC RANK
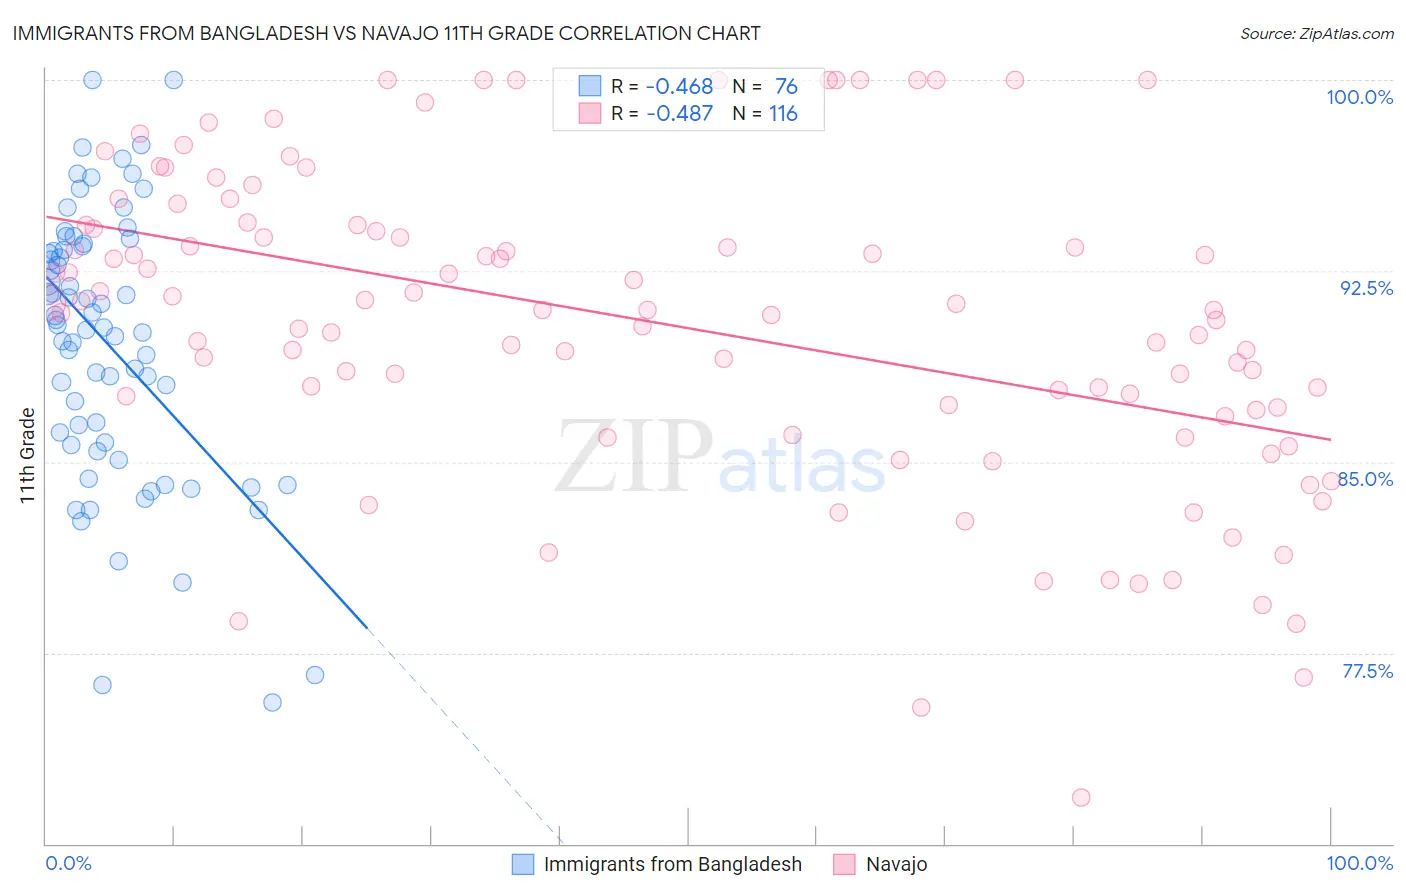
Immigrants from Bangladesh vs Navajo 11th Grade Correlation Chart
The statistical analysis conducted on geographies consisting of 203,672,706 people shows a moderate negative correlation between the proportion of Immigrants from Bangladesh and percentage of population with at least 11th grade education in the United States with a correlation coefficient (R) of -0.468 and weighted average of 89.5%. Similarly, the statistical analysis conducted on geographies consisting of 224,872,858 people shows a moderate negative correlation between the proportion of Navajo and percentage of population with at least 11th grade education in the United States with a correlation coefficient (R) of -0.487 and weighted average of 90.0%, a difference of 0.55%.
11th Grade Correlation Summary
| Measurement | Immigrants from Bangladesh | Navajo |
| Minimum | 75.6% | 71.8% |
| Maximum | 100.0% | 100.0% |
| Range | 24.4% | 28.2% |
| Mean | 89.6% | 90.4% |
| Median | 90.3% | 91.0% |
| Interquartile 25% (IQ1) | 85.7% | 87.1% |
| Interquartile 75% (IQ3) | 93.4% | 94.2% |
| Interquartile Range (IQR) | 7.7% | 7.2% |
| Standard Deviation (Sample) | 5.3% | 6.1% |
| Standard Deviation (Population) | 5.3% | 6.1% |
Demographics Similar to Immigrants from Bangladesh and Navajo by 11th Grade
In terms of 11th grade, the demographic groups most similar to Immigrants from Bangladesh are Yaqui (89.5%, a difference of 0.010%), Nepalese (89.5%, a difference of 0.020%), Immigrants from Dominica (89.5%, a difference of 0.040%), Vietnamese (89.4%, a difference of 0.080%), and Ecuadorian (89.6%, a difference of 0.10%). Similarly, the demographic groups most similar to Navajo are Fijian (90.0%, a difference of 0.040%), Immigrants from Vietnam (90.0%, a difference of 0.060%), Immigrants from Fiji (89.9%, a difference of 0.070%), Japanese (89.9%, a difference of 0.10%), and Immigrants from Haiti (89.9%, a difference of 0.11%).
| Demographics | Rating | Rank | 11th Grade |
| Natives/Alaskans | 0.0 /100 | #293 | Tragic 90.2% |
| Immigrants | Grenada | 0.0 /100 | #294 | Tragic 90.1% |
| Immigrants | Vietnam | 0.0 /100 | #295 | Tragic 90.0% |
| Fijians | 0.0 /100 | #296 | Tragic 90.0% |
| Navajo | 0.0 /100 | #297 | Tragic 90.0% |
| Immigrants | Fiji | 0.0 /100 | #298 | Tragic 89.9% |
| Japanese | 0.0 /100 | #299 | Tragic 89.9% |
| Immigrants | Haiti | 0.0 /100 | #300 | Tragic 89.9% |
| Guyanese | 0.0 /100 | #301 | Tragic 89.9% |
| Immigrants | Guyana | 0.0 /100 | #302 | Tragic 89.7% |
| Immigrants | Immigrants | 0.0 /100 | #303 | Tragic 89.7% |
| Yuman | 0.0 /100 | #304 | Tragic 89.7% |
| Immigrants | Cambodia | 0.0 /100 | #305 | Tragic 89.6% |
| Ecuadorians | 0.0 /100 | #306 | Tragic 89.6% |
| Immigrants | Dominica | 0.0 /100 | #307 | Tragic 89.5% |
| Nepalese | 0.0 /100 | #308 | Tragic 89.5% |
| Immigrants | Bangladesh | 0.0 /100 | #309 | Tragic 89.5% |
| Yaqui | 0.0 /100 | #310 | Tragic 89.5% |
| Vietnamese | 0.0 /100 | #311 | Tragic 89.4% |
| Immigrants | Portugal | 0.0 /100 | #312 | Tragic 89.3% |
| Immigrants | Caribbean | 0.0 /100 | #313 | Tragic 89.1% |