Swedish vs Immigrants from Russia 11th Grade
COMPARE
Swedish
Immigrants from Russia
11th Grade
11th Grade Comparison
Swedes
Immigrants from Russia
94.9%
11TH GRADE
100.0/ 100
METRIC RATING
2nd/ 347
METRIC RANK
93.3%
11TH GRADE
96.6/ 100
METRIC RATING
120th/ 347
METRIC RANK
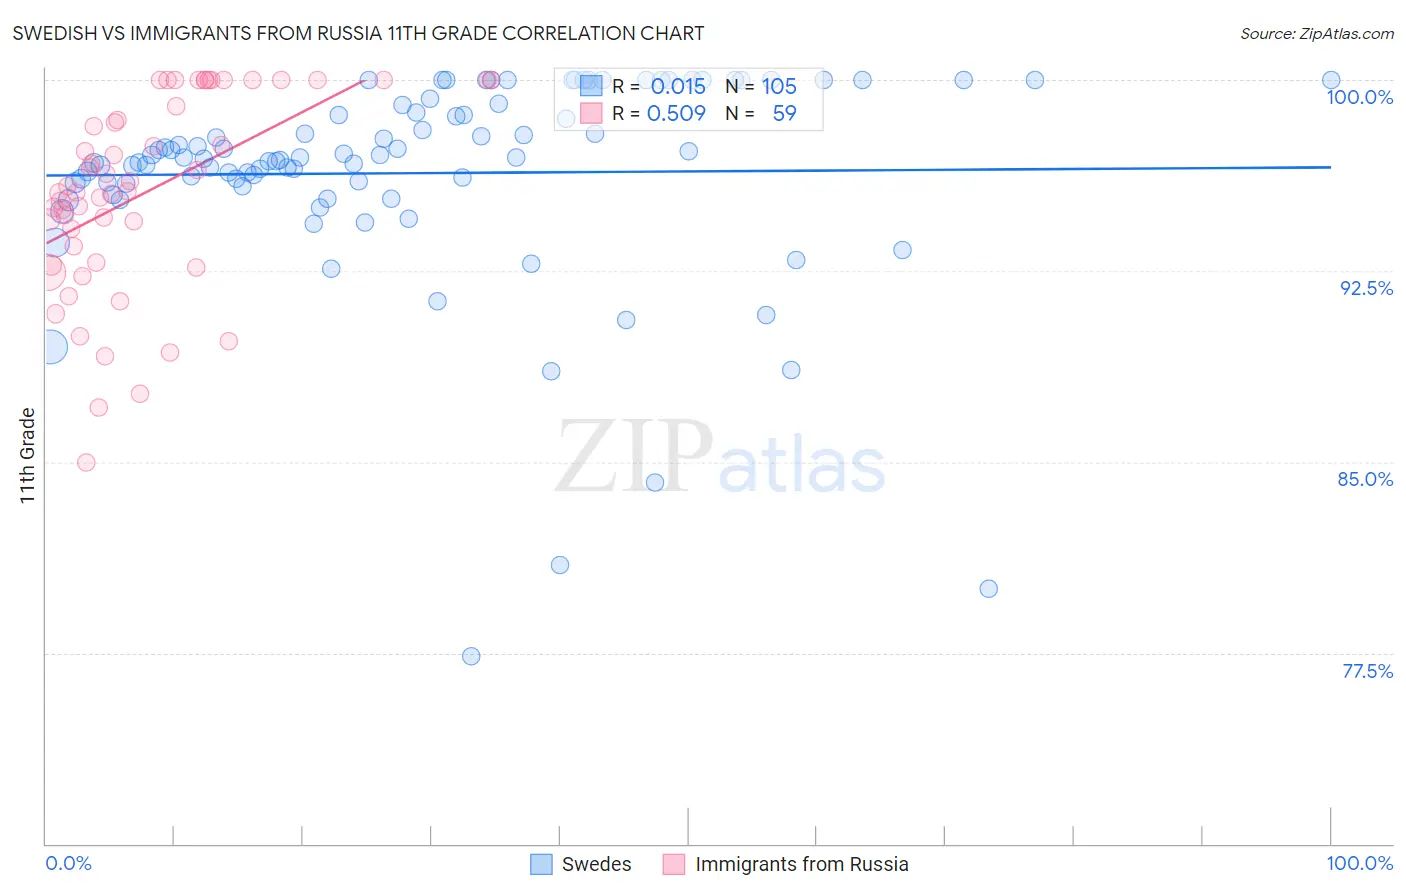
Swedish vs Immigrants from Russia 11th Grade Correlation Chart
The statistical analysis conducted on geographies consisting of 539,231,897 people shows no correlation between the proportion of Swedes and percentage of population with at least 11th grade education in the United States with a correlation coefficient (R) of 0.015 and weighted average of 94.9%. Similarly, the statistical analysis conducted on geographies consisting of 347,948,494 people shows a substantial positive correlation between the proportion of Immigrants from Russia and percentage of population with at least 11th grade education in the United States with a correlation coefficient (R) of 0.509 and weighted average of 93.3%, a difference of 1.8%.
11th Grade Correlation Summary
| Measurement | Swedish | Immigrants from Russia |
| Minimum | 77.4% | 85.0% |
| Maximum | 100.0% | 100.0% |
| Range | 22.6% | 15.0% |
| Mean | 96.3% | 95.6% |
| Median | 96.9% | 95.7% |
| Interquartile 25% (IQ1) | 95.9% | 92.8% |
| Interquartile 75% (IQ3) | 99.0% | 100.0% |
| Interquartile Range (IQR) | 3.1% | 7.2% |
| Standard Deviation (Sample) | 4.1% | 3.8% |
| Standard Deviation (Population) | 4.1% | 3.8% |
Similar Demographics by 11th Grade
Demographics Similar to Swedes by 11th Grade
In terms of 11th grade, the demographic groups most similar to Swedes are Slovene (94.9%, a difference of 0.010%), Slovak (94.9%, a difference of 0.040%), Carpatho Rusyn (94.8%, a difference of 0.10%), Lithuanian (94.8%, a difference of 0.14%), and Polish (94.8%, a difference of 0.20%).
| Demographics | Rating | Rank | 11th Grade |
| Norwegians | 100.0 /100 | #1 | Exceptional 95.2% |
| Swedes | 100.0 /100 | #2 | Exceptional 94.9% |
| Slovenes | 100.0 /100 | #3 | Exceptional 94.9% |
| Slovaks | 100.0 /100 | #4 | Exceptional 94.9% |
| Carpatho Rusyns | 100.0 /100 | #5 | Exceptional 94.8% |
| Lithuanians | 100.0 /100 | #6 | Exceptional 94.8% |
| Poles | 100.0 /100 | #7 | Exceptional 94.8% |
| Croatians | 100.0 /100 | #8 | Exceptional 94.7% |
| Danes | 100.0 /100 | #9 | Exceptional 94.7% |
| Finns | 100.0 /100 | #10 | Exceptional 94.7% |
| Germans | 100.0 /100 | #11 | Exceptional 94.7% |
| Latvians | 100.0 /100 | #12 | Exceptional 94.7% |
| Chinese | 100.0 /100 | #13 | Exceptional 94.6% |
| Eastern Europeans | 100.0 /100 | #14 | Exceptional 94.6% |
| Bulgarians | 100.0 /100 | #15 | Exceptional 94.5% |
Demographics Similar to Immigrants from Russia by 11th Grade
In terms of 11th grade, the demographic groups most similar to Immigrants from Russia are German Russian (93.3%, a difference of 0.020%), Immigrants from Belarus (93.3%, a difference of 0.020%), Immigrants from Korea (93.3%, a difference of 0.030%), Israeli (93.3%, a difference of 0.030%), and Immigrants from Greece (93.2%, a difference of 0.050%).
| Demographics | Rating | Rank | 11th Grade |
| Immigrants | Zimbabwe | 97.8 /100 | #113 | Exceptional 93.4% |
| Jordanians | 97.8 /100 | #114 | Exceptional 93.4% |
| Palestinians | 97.7 /100 | #115 | Exceptional 93.4% |
| Immigrants | Hungary | 97.5 /100 | #116 | Exceptional 93.4% |
| Whites/Caucasians | 97.4 /100 | #117 | Exceptional 93.3% |
| Immigrants | Korea | 97.0 /100 | #118 | Exceptional 93.3% |
| Israelis | 97.0 /100 | #119 | Exceptional 93.3% |
| Immigrants | Russia | 96.6 /100 | #120 | Exceptional 93.3% |
| German Russians | 96.4 /100 | #121 | Exceptional 93.3% |
| Immigrants | Belarus | 96.3 /100 | #122 | Exceptional 93.3% |
| Immigrants | Greece | 95.9 /100 | #123 | Exceptional 93.2% |
| Immigrants | Eastern Europe | 95.9 /100 | #124 | Exceptional 93.2% |
| Immigrants | Sri Lanka | 95.6 /100 | #125 | Exceptional 93.2% |
| Basques | 95.2 /100 | #126 | Exceptional 93.2% |
| Immigrants | Kazakhstan | 92.4 /100 | #127 | Exceptional 93.1% |