Swedish vs Indonesian Receiving Food Stamps
COMPARE
Swedish
Indonesian
Receiving Food Stamps
Receiving Food Stamps Comparison
Swedes
Indonesians
9.2%
RECEIVING FOOD STAMPS
99.8/ 100
METRIC RATING
26th/ 347
METRIC RANK
13.9%
RECEIVING FOOD STAMPS
0.6/ 100
METRIC RATING
249th/ 347
METRIC RANK
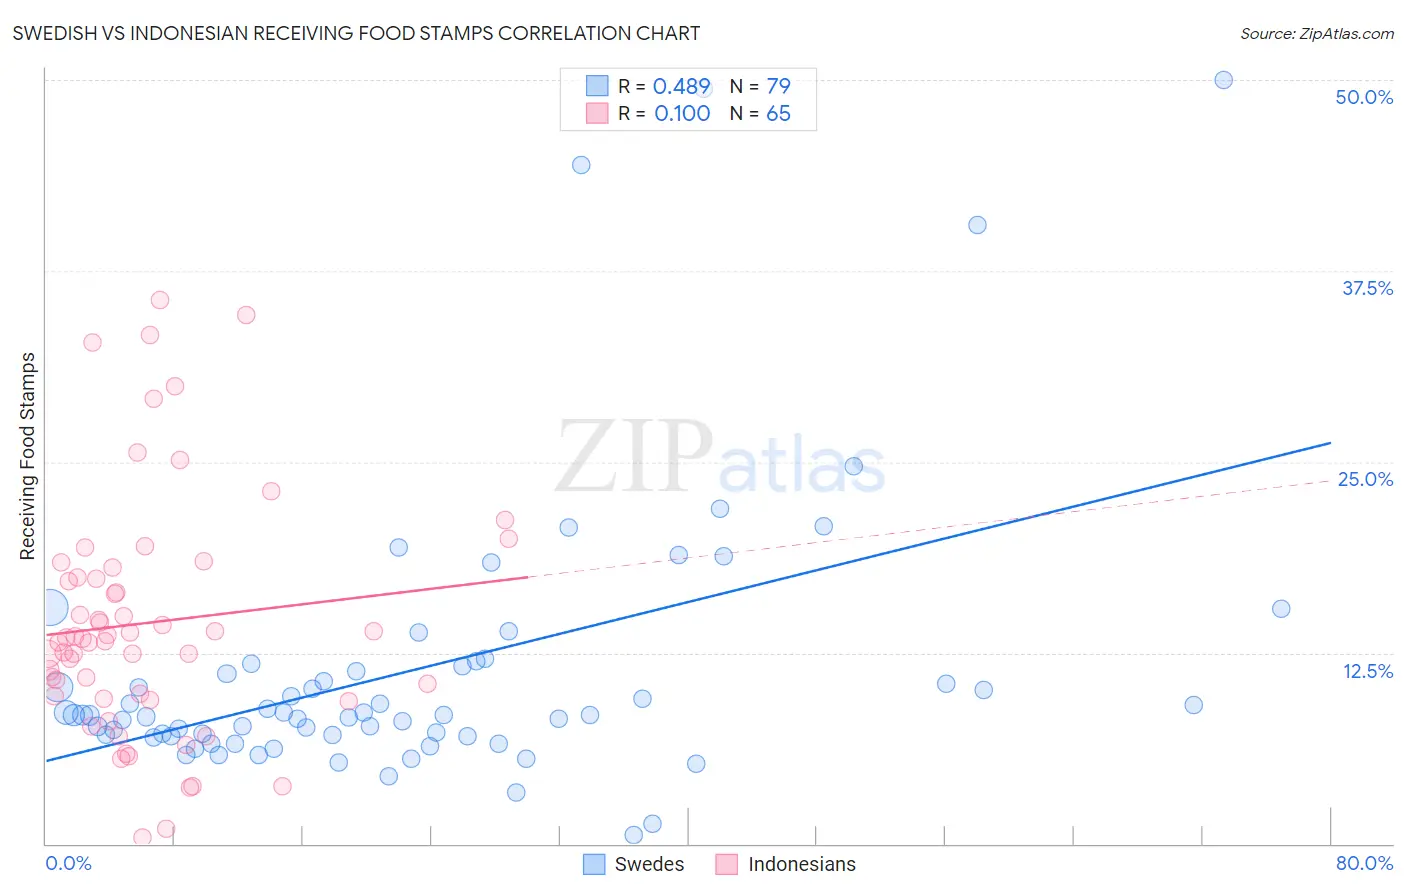
Swedish vs Indonesian Receiving Food Stamps Correlation Chart
The statistical analysis conducted on geographies consisting of 536,141,990 people shows a moderate positive correlation between the proportion of Swedes and percentage of population receiving government assistance and/or food stamps in the United States with a correlation coefficient (R) of 0.489 and weighted average of 9.2%. Similarly, the statistical analysis conducted on geographies consisting of 162,471,591 people shows a poor positive correlation between the proportion of Indonesians and percentage of population receiving government assistance and/or food stamps in the United States with a correlation coefficient (R) of 0.100 and weighted average of 13.9%, a difference of 50.7%.
Receiving Food Stamps Correlation Summary
| Measurement | Swedish | Indonesian |
| Minimum | 0.60% | 0.40% |
| Maximum | 50.0% | 35.6% |
| Range | 49.4% | 35.2% |
| Mean | 11.4% | 14.5% |
| Median | 8.4% | 13.4% |
| Interquartile 25% (IQ1) | 7.1% | 9.6% |
| Interquartile 75% (IQ3) | 11.6% | 17.8% |
| Interquartile Range (IQR) | 4.6% | 8.2% |
| Standard Deviation (Sample) | 9.3% | 7.9% |
| Standard Deviation (Population) | 9.2% | 7.8% |
Similar Demographics by Receiving Food Stamps
Demographics Similar to Swedes by Receiving Food Stamps
In terms of receiving food stamps, the demographic groups most similar to Swedes are Immigrants from Ireland (9.2%, a difference of 0.20%), Bhutanese (9.2%, a difference of 0.24%), Czech (9.2%, a difference of 0.25%), Immigrants from Northern Europe (9.2%, a difference of 0.30%), and Eastern European (9.2%, a difference of 0.32%).
| Demographics | Rating | Rank | Receiving Food Stamps |
| Immigrants | Hong Kong | 99.8 /100 | #19 | Exceptional 9.1% |
| Latvians | 99.8 /100 | #20 | Exceptional 9.1% |
| Luxembourgers | 99.8 /100 | #21 | Exceptional 9.1% |
| Immigrants | Australia | 99.8 /100 | #22 | Exceptional 9.2% |
| Eastern Europeans | 99.8 /100 | #23 | Exceptional 9.2% |
| Immigrants | Northern Europe | 99.8 /100 | #24 | Exceptional 9.2% |
| Immigrants | Ireland | 99.8 /100 | #25 | Exceptional 9.2% |
| Swedes | 99.8 /100 | #26 | Exceptional 9.2% |
| Bhutanese | 99.8 /100 | #27 | Exceptional 9.2% |
| Czechs | 99.8 /100 | #28 | Exceptional 9.2% |
| Immigrants | Lithuania | 99.8 /100 | #29 | Exceptional 9.2% |
| Immigrants | Sweden | 99.7 /100 | #30 | Exceptional 9.3% |
| Immigrants | Eastern Asia | 99.7 /100 | #31 | Exceptional 9.3% |
| Bolivians | 99.7 /100 | #32 | Exceptional 9.3% |
| Zimbabweans | 99.6 /100 | #33 | Exceptional 9.5% |
Demographics Similar to Indonesians by Receiving Food Stamps
In terms of receiving food stamps, the demographic groups most similar to Indonesians are Immigrants from Cambodia (13.9%, a difference of 0.17%), Yaqui (13.9%, a difference of 0.24%), Immigrants from Laos (13.8%, a difference of 0.63%), Ghanaian (14.0%, a difference of 0.69%), and Mexican American Indian (13.8%, a difference of 0.73%).
| Demographics | Rating | Rank | Receiving Food Stamps |
| Immigrants | Panama | 1.0 /100 | #242 | Tragic 13.6% |
| Somalis | 0.9 /100 | #243 | Tragic 13.7% |
| Cajuns | 0.9 /100 | #244 | Tragic 13.7% |
| Immigrants | Somalia | 0.9 /100 | #245 | Tragic 13.7% |
| Cree | 0.8 /100 | #246 | Tragic 13.7% |
| Mexican American Indians | 0.7 /100 | #247 | Tragic 13.8% |
| Immigrants | Laos | 0.7 /100 | #248 | Tragic 13.8% |
| Indonesians | 0.6 /100 | #249 | Tragic 13.9% |
| Immigrants | Cambodia | 0.5 /100 | #250 | Tragic 13.9% |
| Yaqui | 0.5 /100 | #251 | Tragic 13.9% |
| Ghanaians | 0.5 /100 | #252 | Tragic 14.0% |
| Spanish Americans | 0.4 /100 | #253 | Tragic 14.0% |
| Marshallese | 0.3 /100 | #254 | Tragic 14.1% |
| Sub-Saharan Africans | 0.3 /100 | #255 | Tragic 14.1% |
| Japanese | 0.3 /100 | #256 | Tragic 14.1% |