Dutch West Indian vs Indonesian 11th Grade
COMPARE
Dutch West Indian
Indonesian
11th Grade
11th Grade Comparison
Dutch West Indians
Indonesians
90.7%
11TH GRADE
0.0/ 100
METRIC RATING
281st/ 347
METRIC RANK
90.3%
11TH GRADE
0.0/ 100
METRIC RATING
290th/ 347
METRIC RANK
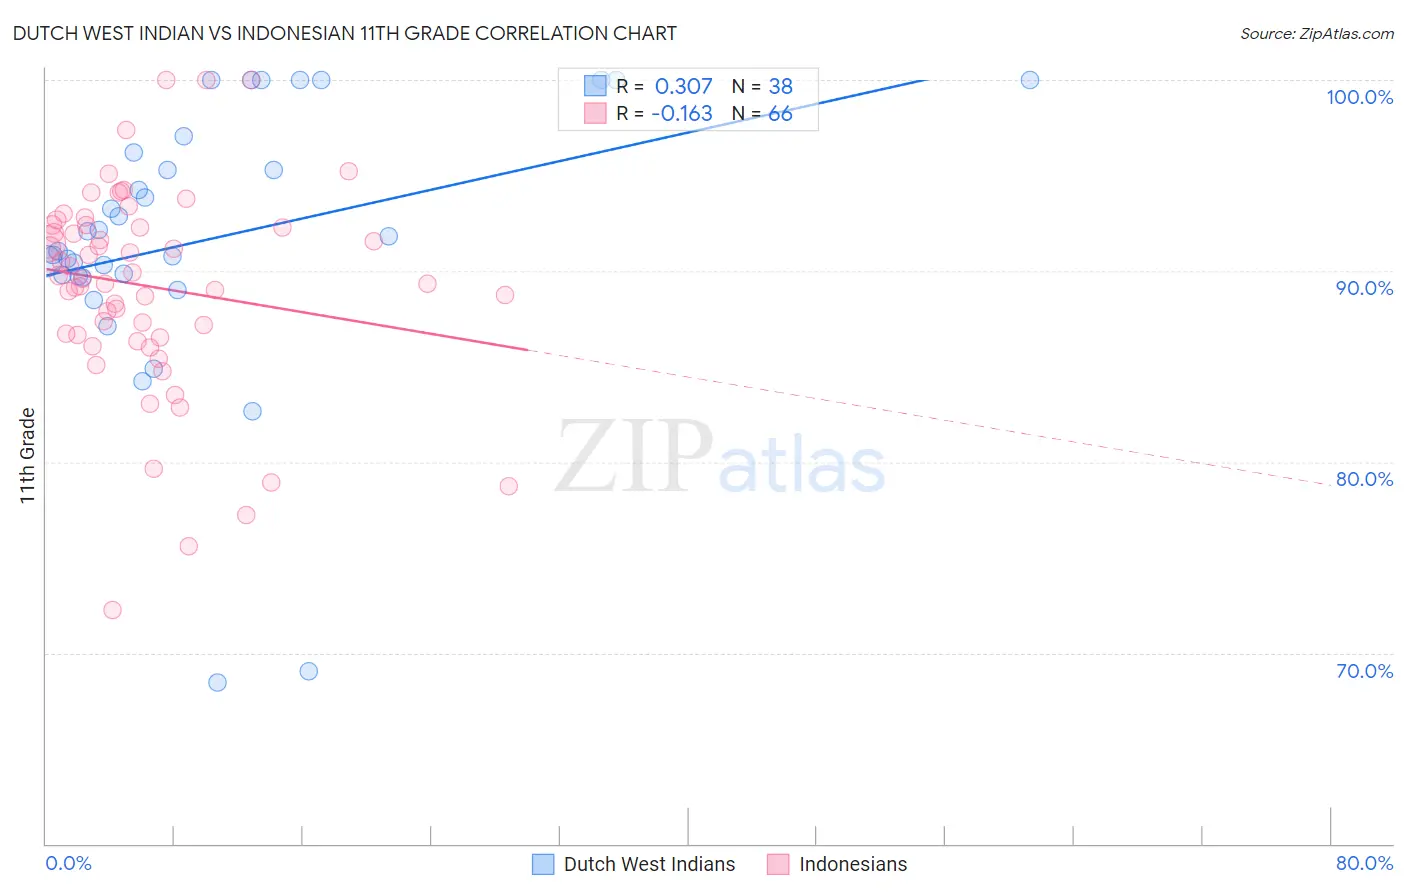
Dutch West Indian vs Indonesian 11th Grade Correlation Chart
The statistical analysis conducted on geographies consisting of 85,776,098 people shows a mild positive correlation between the proportion of Dutch West Indians and percentage of population with at least 11th grade education in the United States with a correlation coefficient (R) of 0.307 and weighted average of 90.7%. Similarly, the statistical analysis conducted on geographies consisting of 162,727,113 people shows a poor negative correlation between the proportion of Indonesians and percentage of population with at least 11th grade education in the United States with a correlation coefficient (R) of -0.163 and weighted average of 90.3%, a difference of 0.41%.
11th Grade Correlation Summary
| Measurement | Dutch West Indian | Indonesian |
| Minimum | 68.4% | 72.2% |
| Maximum | 100.0% | 100.0% |
| Range | 31.6% | 27.8% |
| Mean | 91.6% | 89.2% |
| Median | 91.4% | 89.7% |
| Interquartile 25% (IQ1) | 89.7% | 86.6% |
| Interquartile 75% (IQ3) | 96.2% | 92.4% |
| Interquartile Range (IQR) | 6.5% | 5.8% |
| Standard Deviation (Sample) | 7.2% | 5.4% |
| Standard Deviation (Population) | 7.1% | 5.4% |
Demographics Similar to Dutch West Indians and Indonesians by 11th Grade
In terms of 11th grade, the demographic groups most similar to Dutch West Indians are Immigrants from St. Vincent and the Grenadines (90.7%, a difference of 0.010%), Immigrants from Barbados (90.7%, a difference of 0.020%), Sri Lankan (90.7%, a difference of 0.050%), Barbadian (90.8%, a difference of 0.12%), and Malaysian (90.8%, a difference of 0.16%). Similarly, the demographic groups most similar to Indonesians are British West Indian (90.3%, a difference of 0.020%), Haitian (90.3%, a difference of 0.040%), Pennsylvania German (90.3%, a difference of 0.050%), Apache (90.4%, a difference of 0.070%), and Cuban (90.2%, a difference of 0.070%).
| Demographics | Rating | Rank | 11th Grade |
| Immigrants | South Eastern Asia | 0.1 /100 | #275 | Tragic 90.9% |
| Bangladeshis | 0.1 /100 | #276 | Tragic 90.9% |
| Immigrants | Congo | 0.1 /100 | #277 | Tragic 90.9% |
| Malaysians | 0.1 /100 | #278 | Tragic 90.8% |
| Barbadians | 0.0 /100 | #279 | Tragic 90.8% |
| Sri Lankans | 0.0 /100 | #280 | Tragic 90.7% |
| Dutch West Indians | 0.0 /100 | #281 | Tragic 90.7% |
| Immigrants | St. Vincent and the Grenadines | 0.0 /100 | #282 | Tragic 90.7% |
| Immigrants | Barbados | 0.0 /100 | #283 | Tragic 90.7% |
| Immigrants | Laos | 0.0 /100 | #284 | Tragic 90.5% |
| Immigrants | Burma/Myanmar | 0.0 /100 | #285 | Tragic 90.4% |
| Immigrants | West Indies | 0.0 /100 | #286 | Tragic 90.4% |
| Apache | 0.0 /100 | #287 | Tragic 90.4% |
| Pennsylvania Germans | 0.0 /100 | #288 | Tragic 90.3% |
| British West Indians | 0.0 /100 | #289 | Tragic 90.3% |
| Indonesians | 0.0 /100 | #290 | Tragic 90.3% |
| Haitians | 0.0 /100 | #291 | Tragic 90.3% |
| Cubans | 0.0 /100 | #292 | Tragic 90.2% |
| Natives/Alaskans | 0.0 /100 | #293 | Tragic 90.2% |
| Immigrants | Grenada | 0.0 /100 | #294 | Tragic 90.1% |
| Immigrants | Vietnam | 0.0 /100 | #295 | Tragic 90.0% |