Potawatomi vs Indonesian 11th Grade
COMPARE
Potawatomi
Indonesian
11th Grade
11th Grade Comparison
Potawatomi
Indonesians
92.8%
11TH GRADE
74.3/ 100
METRIC RATING
151st/ 347
METRIC RANK
90.3%
11TH GRADE
0.0/ 100
METRIC RATING
290th/ 347
METRIC RANK
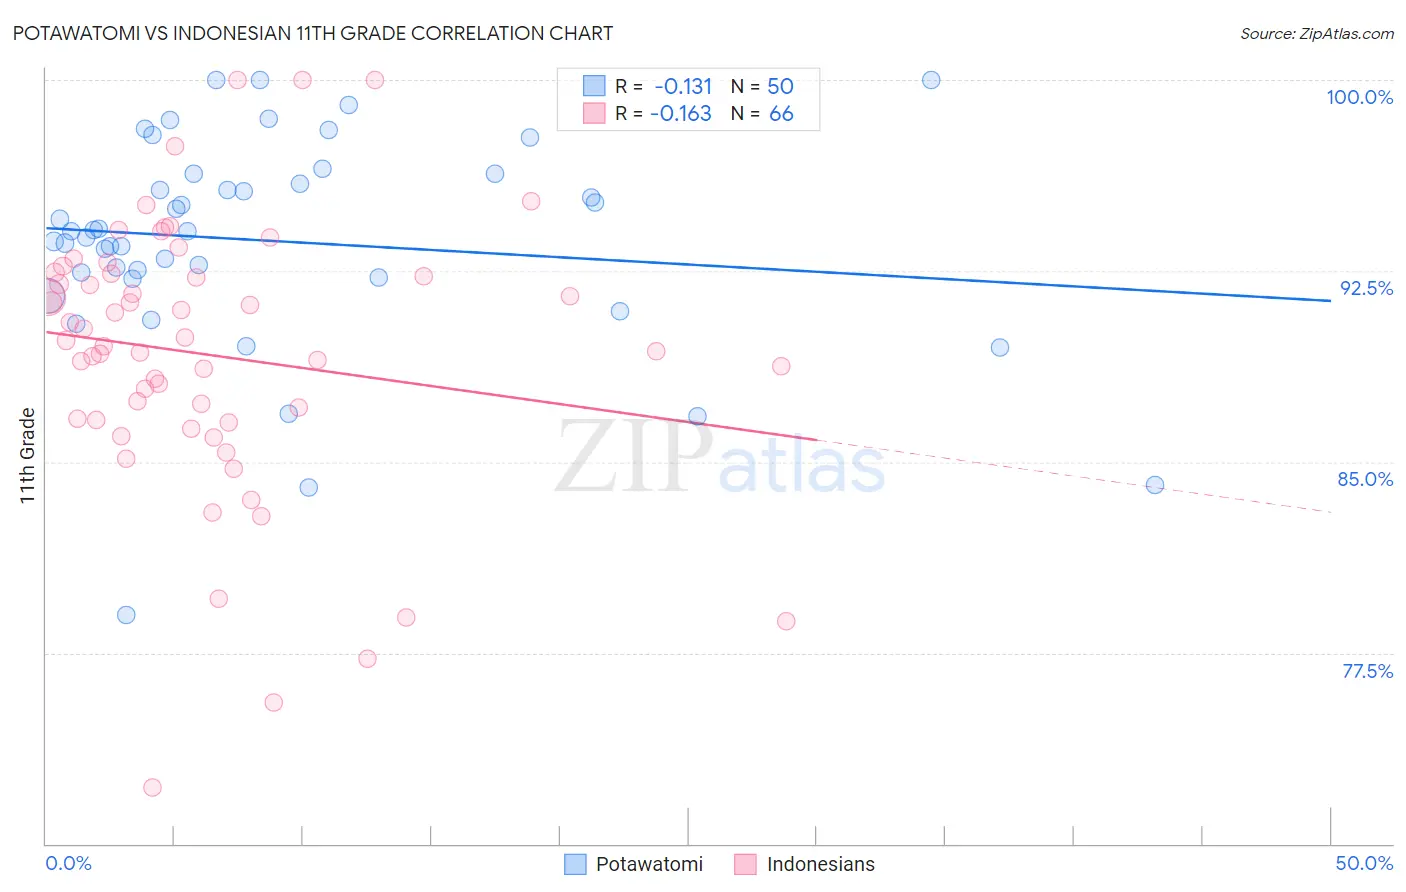
Potawatomi vs Indonesian 11th Grade Correlation Chart
The statistical analysis conducted on geographies consisting of 117,774,178 people shows a poor negative correlation between the proportion of Potawatomi and percentage of population with at least 11th grade education in the United States with a correlation coefficient (R) of -0.131 and weighted average of 92.8%. Similarly, the statistical analysis conducted on geographies consisting of 162,727,113 people shows a poor negative correlation between the proportion of Indonesians and percentage of population with at least 11th grade education in the United States with a correlation coefficient (R) of -0.163 and weighted average of 90.3%, a difference of 2.7%.
11th Grade Correlation Summary
| Measurement | Potawatomi | Indonesian |
| Minimum | 79.0% | 72.2% |
| Maximum | 100.0% | 100.0% |
| Range | 21.0% | 27.8% |
| Mean | 93.7% | 89.2% |
| Median | 94.0% | 89.7% |
| Interquartile 25% (IQ1) | 92.3% | 86.6% |
| Interquartile 75% (IQ3) | 96.3% | 92.4% |
| Interquartile Range (IQR) | 4.1% | 5.8% |
| Standard Deviation (Sample) | 4.3% | 5.4% |
| Standard Deviation (Population) | 4.2% | 5.4% |
Similar Demographics by 11th Grade
Demographics Similar to Potawatomi by 11th Grade
In terms of 11th grade, the demographic groups most similar to Potawatomi are Iraqi (92.8%, a difference of 0.0%), Brazilian (92.8%, a difference of 0.0%), Osage (92.7%, a difference of 0.010%), Argentinean (92.7%, a difference of 0.010%), and Immigrants from Spain (92.7%, a difference of 0.020%).
| Demographics | Rating | Rank | 11th Grade |
| Assyrians/Chaldeans/Syriacs | 80.5 /100 | #144 | Excellent 92.8% |
| Pakistanis | 79.6 /100 | #145 | Good 92.8% |
| Iroquois | 79.1 /100 | #146 | Good 92.8% |
| Immigrants | Kenya | 78.7 /100 | #147 | Good 92.8% |
| Hmong | 78.6 /100 | #148 | Good 92.8% |
| Immigrants | Poland | 78.5 /100 | #149 | Good 92.8% |
| Immigrants | Egypt | 77.5 /100 | #150 | Good 92.8% |
| Potawatomi | 74.3 /100 | #151 | Good 92.8% |
| Iraqis | 74.2 /100 | #152 | Good 92.8% |
| Brazilians | 73.9 /100 | #153 | Good 92.8% |
| Osage | 73.4 /100 | #154 | Good 92.7% |
| Argentineans | 73.4 /100 | #155 | Good 92.7% |
| Immigrants | Spain | 73.0 /100 | #156 | Good 92.7% |
| Immigrants | Eastern Asia | 72.6 /100 | #157 | Good 92.7% |
| Immigrants | Venezuela | 72.0 /100 | #158 | Good 92.7% |
Demographics Similar to Indonesians by 11th Grade
In terms of 11th grade, the demographic groups most similar to Indonesians are British West Indian (90.3%, a difference of 0.020%), Haitian (90.3%, a difference of 0.040%), Pennsylvania German (90.3%, a difference of 0.050%), Apache (90.4%, a difference of 0.070%), and Cuban (90.2%, a difference of 0.070%).
| Demographics | Rating | Rank | 11th Grade |
| Immigrants | Barbados | 0.0 /100 | #283 | Tragic 90.7% |
| Immigrants | Laos | 0.0 /100 | #284 | Tragic 90.5% |
| Immigrants | Burma/Myanmar | 0.0 /100 | #285 | Tragic 90.4% |
| Immigrants | West Indies | 0.0 /100 | #286 | Tragic 90.4% |
| Apache | 0.0 /100 | #287 | Tragic 90.4% |
| Pennsylvania Germans | 0.0 /100 | #288 | Tragic 90.3% |
| British West Indians | 0.0 /100 | #289 | Tragic 90.3% |
| Indonesians | 0.0 /100 | #290 | Tragic 90.3% |
| Haitians | 0.0 /100 | #291 | Tragic 90.3% |
| Cubans | 0.0 /100 | #292 | Tragic 90.2% |
| Natives/Alaskans | 0.0 /100 | #293 | Tragic 90.2% |
| Immigrants | Grenada | 0.0 /100 | #294 | Tragic 90.1% |
| Immigrants | Vietnam | 0.0 /100 | #295 | Tragic 90.0% |
| Fijians | 0.0 /100 | #296 | Tragic 90.0% |
| Navajo | 0.0 /100 | #297 | Tragic 90.0% |