Swedish vs Immigrants from Liberia 6th Grade
COMPARE
Swedish
Immigrants from Liberia
6th Grade
6th Grade Comparison
Swedes
Immigrants from Liberia
98.2%
6TH GRADE
100.0/ 100
METRIC RATING
10th/ 347
METRIC RANK
96.6%
6TH GRADE
1.6/ 100
METRIC RATING
243rd/ 347
METRIC RANK
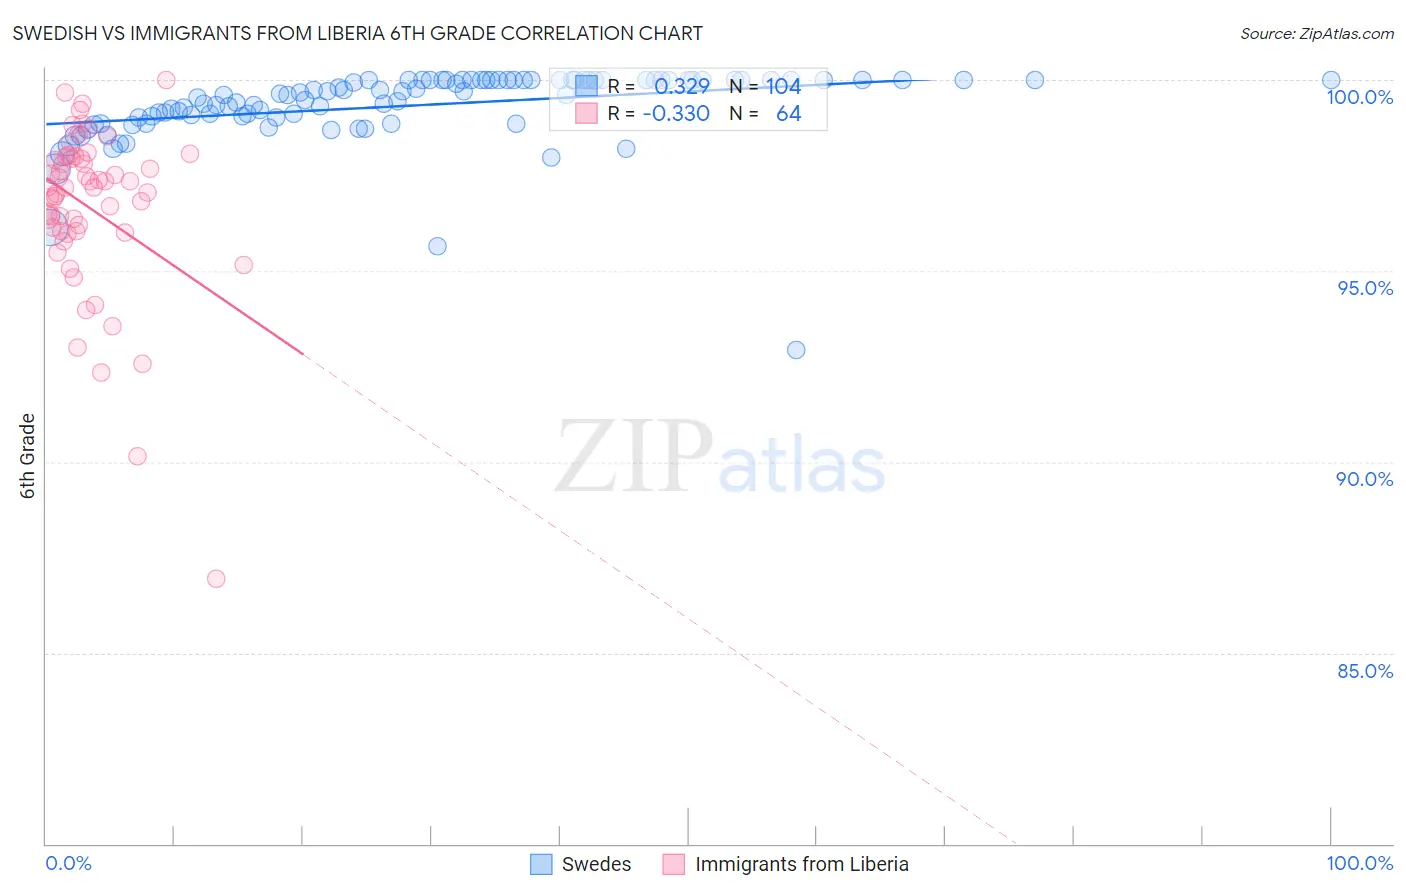
Swedish vs Immigrants from Liberia 6th Grade Correlation Chart
The statistical analysis conducted on geographies consisting of 539,231,492 people shows a mild positive correlation between the proportion of Swedes and percentage of population with at least 6th grade education in the United States with a correlation coefficient (R) of 0.329 and weighted average of 98.2%. Similarly, the statistical analysis conducted on geographies consisting of 135,294,272 people shows a mild negative correlation between the proportion of Immigrants from Liberia and percentage of population with at least 6th grade education in the United States with a correlation coefficient (R) of -0.330 and weighted average of 96.6%, a difference of 1.6%.
6th Grade Correlation Summary
| Measurement | Swedish | Immigrants from Liberia |
| Minimum | 92.9% | 86.9% |
| Maximum | 100.0% | 100.0% |
| Range | 7.1% | 13.1% |
| Mean | 99.3% | 96.7% |
| Median | 99.6% | 97.2% |
| Interquartile 25% (IQ1) | 99.0% | 96.0% |
| Interquartile 75% (IQ3) | 100.0% | 97.9% |
| Interquartile Range (IQR) | 0.98% | 1.9% |
| Standard Deviation (Sample) | 1.00% | 2.2% |
| Standard Deviation (Population) | 0.99% | 2.2% |
Similar Demographics by 6th Grade
Demographics Similar to Swedes by 6th Grade
In terms of 6th grade, the demographic groups most similar to Swedes are English (98.1%, a difference of 0.010%), Alaskan Athabascan (98.1%, a difference of 0.020%), Slovene (98.2%, a difference of 0.030%), Tlingit-Haida (98.1%, a difference of 0.040%), and Carpatho Rusyn (98.1%, a difference of 0.050%).
| Demographics | Rating | Rank | 6th Grade |
| Welsh | 100.0 /100 | #3 | Exceptional 98.5% |
| Dutch | 100.0 /100 | #4 | Exceptional 98.4% |
| Tsimshian | 100.0 /100 | #5 | Exceptional 98.3% |
| Norwegians | 100.0 /100 | #6 | Exceptional 98.3% |
| Germans | 100.0 /100 | #7 | Exceptional 98.2% |
| Slovaks | 100.0 /100 | #8 | Exceptional 98.2% |
| Slovenes | 100.0 /100 | #9 | Exceptional 98.2% |
| Swedes | 100.0 /100 | #10 | Exceptional 98.2% |
| English | 100.0 /100 | #11 | Exceptional 98.1% |
| Alaskan Athabascans | 100.0 /100 | #12 | Exceptional 98.1% |
| Tlingit-Haida | 100.0 /100 | #13 | Exceptional 98.1% |
| Carpatho Rusyns | 100.0 /100 | #14 | Exceptional 98.1% |
| Inupiat | 100.0 /100 | #15 | Exceptional 98.1% |
| Scottish | 100.0 /100 | #16 | Exceptional 98.1% |
| Poles | 100.0 /100 | #17 | Exceptional 98.1% |
Demographics Similar to Immigrants from Liberia by 6th Grade
In terms of 6th grade, the demographic groups most similar to Immigrants from Liberia are Senegalese (96.6%, a difference of 0.010%), Immigrants from Asia (96.6%, a difference of 0.010%), Ethiopian (96.6%, a difference of 0.010%), Nigerian (96.6%, a difference of 0.020%), and Indian (Asian) (96.6%, a difference of 0.020%).
| Demographics | Rating | Rank | 6th Grade |
| Immigrants | Indonesia | 2.3 /100 | #236 | Tragic 96.6% |
| Immigrants | Eastern Africa | 2.0 /100 | #237 | Tragic 96.6% |
| Nigerians | 1.9 /100 | #238 | Tragic 96.6% |
| Indians (Asian) | 1.9 /100 | #239 | Tragic 96.6% |
| Koreans | 1.9 /100 | #240 | Tragic 96.6% |
| Senegalese | 1.8 /100 | #241 | Tragic 96.6% |
| Immigrants | Asia | 1.8 /100 | #242 | Tragic 96.6% |
| Immigrants | Liberia | 1.6 /100 | #243 | Tragic 96.6% |
| Ethiopians | 1.5 /100 | #244 | Tragic 96.6% |
| Immigrants | Costa Rica | 1.3 /100 | #245 | Tragic 96.6% |
| Immigrants | Africa | 1.3 /100 | #246 | Tragic 96.6% |
| Bolivians | 1.0 /100 | #247 | Tragic 96.5% |
| Tohono O'odham | 1.0 /100 | #248 | Tragic 96.5% |
| Colombians | 0.9 /100 | #249 | Tragic 96.5% |
| Immigrants | Middle Africa | 0.8 /100 | #250 | Tragic 96.5% |