Jamaican vs Immigrants from Jordan Doctorate Degree
COMPARE
Jamaican
Immigrants from Jordan
Doctorate Degree
Doctorate Degree Comparison
Jamaicans
Immigrants from Jordan
1.5%
DOCTORATE DEGREE
0.3/ 100
METRIC RATING
284th/ 347
METRIC RANK
2.0%
DOCTORATE DEGREE
94.8/ 100
METRIC RATING
121st/ 347
METRIC RANK
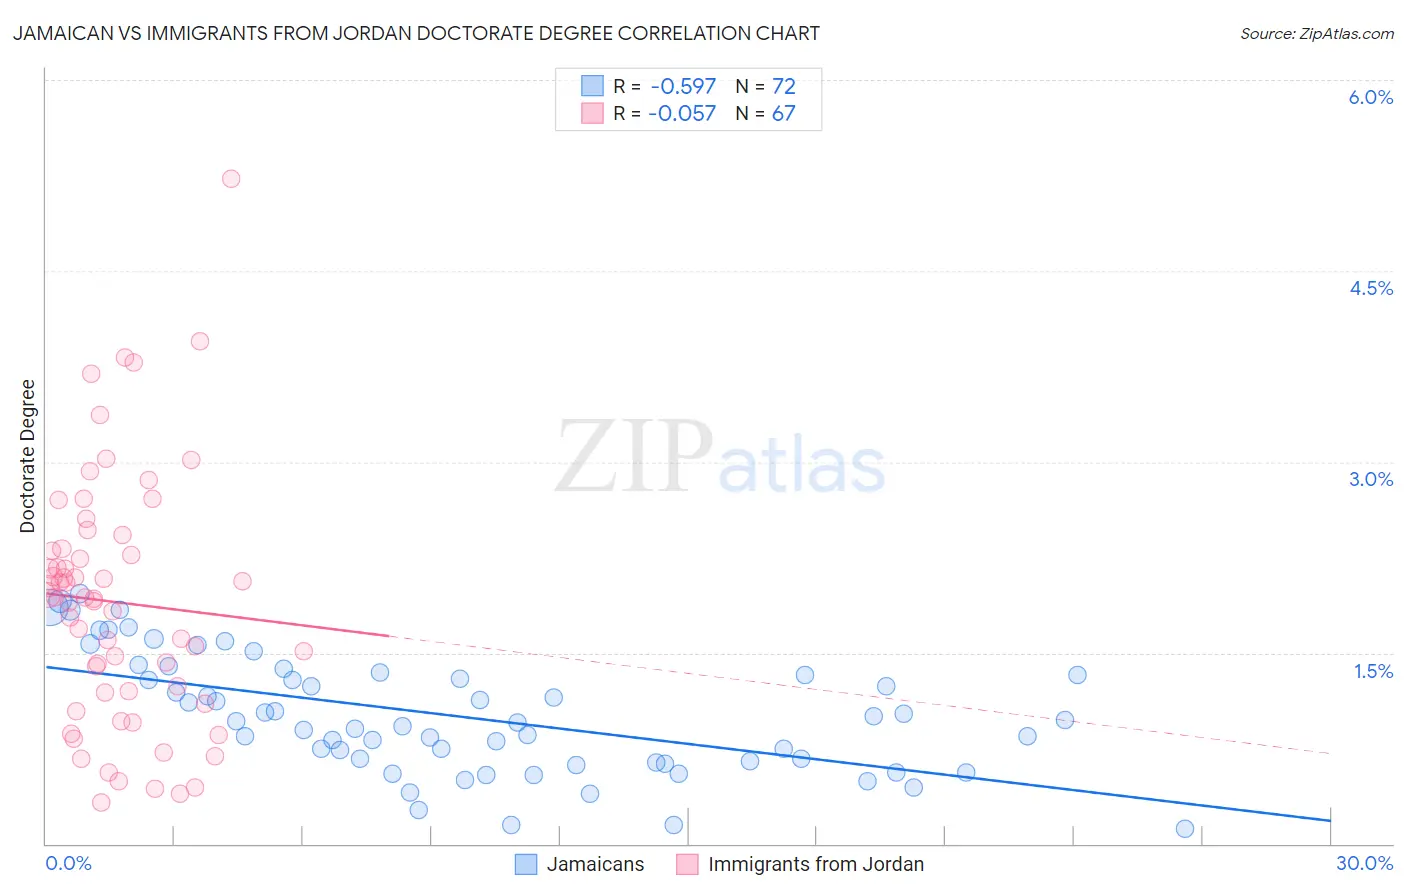
Jamaican vs Immigrants from Jordan Doctorate Degree Correlation Chart
The statistical analysis conducted on geographies consisting of 364,326,977 people shows a substantial negative correlation between the proportion of Jamaicans and percentage of population with at least doctorate degree education in the United States with a correlation coefficient (R) of -0.597 and weighted average of 1.5%. Similarly, the statistical analysis conducted on geographies consisting of 180,883,250 people shows a slight negative correlation between the proportion of Immigrants from Jordan and percentage of population with at least doctorate degree education in the United States with a correlation coefficient (R) of -0.057 and weighted average of 2.0%, a difference of 39.7%.
Doctorate Degree Correlation Summary
| Measurement | Jamaican | Immigrants from Jordan |
| Minimum | 0.12% | 0.32% |
| Maximum | 2.0% | 5.2% |
| Range | 1.8% | 4.9% |
| Mean | 1.0% | 1.9% |
| Median | 0.96% | 1.9% |
| Interquartile 25% (IQ1) | 0.64% | 1.2% |
| Interquartile 75% (IQ3) | 1.3% | 2.3% |
| Interquartile Range (IQR) | 0.69% | 1.1% |
| Standard Deviation (Sample) | 0.46% | 0.98% |
| Standard Deviation (Population) | 0.46% | 0.97% |
Similar Demographics by Doctorate Degree
Demographics Similar to Jamaicans by Doctorate Degree
In terms of doctorate degree, the demographic groups most similar to Jamaicans are Malaysian (1.5%, a difference of 0.030%), Central American (1.5%, a difference of 0.040%), British West Indian (1.5%, a difference of 0.090%), Tohono O'odham (1.5%, a difference of 0.14%), and Ecuadorian (1.5%, a difference of 0.20%).
| Demographics | Rating | Rank | Doctorate Degree |
| Bahamians | 0.4 /100 | #277 | Tragic 1.5% |
| Hawaiians | 0.4 /100 | #278 | Tragic 1.5% |
| Marshallese | 0.4 /100 | #279 | Tragic 1.5% |
| Ecuadorians | 0.4 /100 | #280 | Tragic 1.5% |
| Tohono O'odham | 0.4 /100 | #281 | Tragic 1.5% |
| British West Indians | 0.3 /100 | #282 | Tragic 1.5% |
| Central Americans | 0.3 /100 | #283 | Tragic 1.5% |
| Jamaicans | 0.3 /100 | #284 | Tragic 1.5% |
| Malaysians | 0.3 /100 | #285 | Tragic 1.5% |
| Cherokee | 0.3 /100 | #286 | Tragic 1.5% |
| Cajuns | 0.3 /100 | #287 | Tragic 1.5% |
| Immigrants | El Salvador | 0.3 /100 | #288 | Tragic 1.4% |
| Cape Verdeans | 0.3 /100 | #289 | Tragic 1.4% |
| Choctaw | 0.3 /100 | #290 | Tragic 1.4% |
| Blacks/African Americans | 0.3 /100 | #291 | Tragic 1.4% |
Demographics Similar to Immigrants from Jordan by Doctorate Degree
In terms of doctorate degree, the demographic groups most similar to Immigrants from Jordan are Immigrants from Southern Europe (2.0%, a difference of 0.030%), Immigrants from Morocco (2.0%, a difference of 0.48%), Croatian (2.0%, a difference of 0.48%), Pakistani (2.0%, a difference of 0.76%), and Icelander (2.1%, a difference of 0.90%).
| Demographics | Rating | Rank | Doctorate Degree |
| Immigrants | Croatia | 96.8 /100 | #114 | Exceptional 2.1% |
| Taiwanese | 96.7 /100 | #115 | Exceptional 2.1% |
| Maltese | 96.2 /100 | #116 | Exceptional 2.1% |
| Lebanese | 96.0 /100 | #117 | Exceptional 2.1% |
| Icelanders | 96.0 /100 | #118 | Exceptional 2.1% |
| Pakistanis | 95.8 /100 | #119 | Exceptional 2.0% |
| Immigrants | Morocco | 95.5 /100 | #120 | Exceptional 2.0% |
| Immigrants | Jordan | 94.8 /100 | #121 | Exceptional 2.0% |
| Immigrants | Southern Europe | 94.7 /100 | #122 | Exceptional 2.0% |
| Croatians | 94.0 /100 | #123 | Exceptional 2.0% |
| Ute | 93.2 /100 | #124 | Exceptional 2.0% |
| Moroccans | 93.0 /100 | #125 | Exceptional 2.0% |
| Jordanians | 92.1 /100 | #126 | Exceptional 2.0% |
| Palestinians | 92.0 /100 | #127 | Exceptional 2.0% |
| Immigrants | Zaire | 91.1 /100 | #128 | Exceptional 2.0% |