Sudanese vs Nonimmigrants Bachelor's Degree
COMPARE
Sudanese
Nonimmigrants
Bachelor's Degree
Bachelor's Degree Comparison
Sudanese
Nonimmigrants
38.9%
BACHELOR'S DEGREE
76.4/ 100
METRIC RATING
152nd/ 347
METRIC RANK
34.2%
BACHELOR'S DEGREE
1.8/ 100
METRIC RATING
242nd/ 347
METRIC RANK
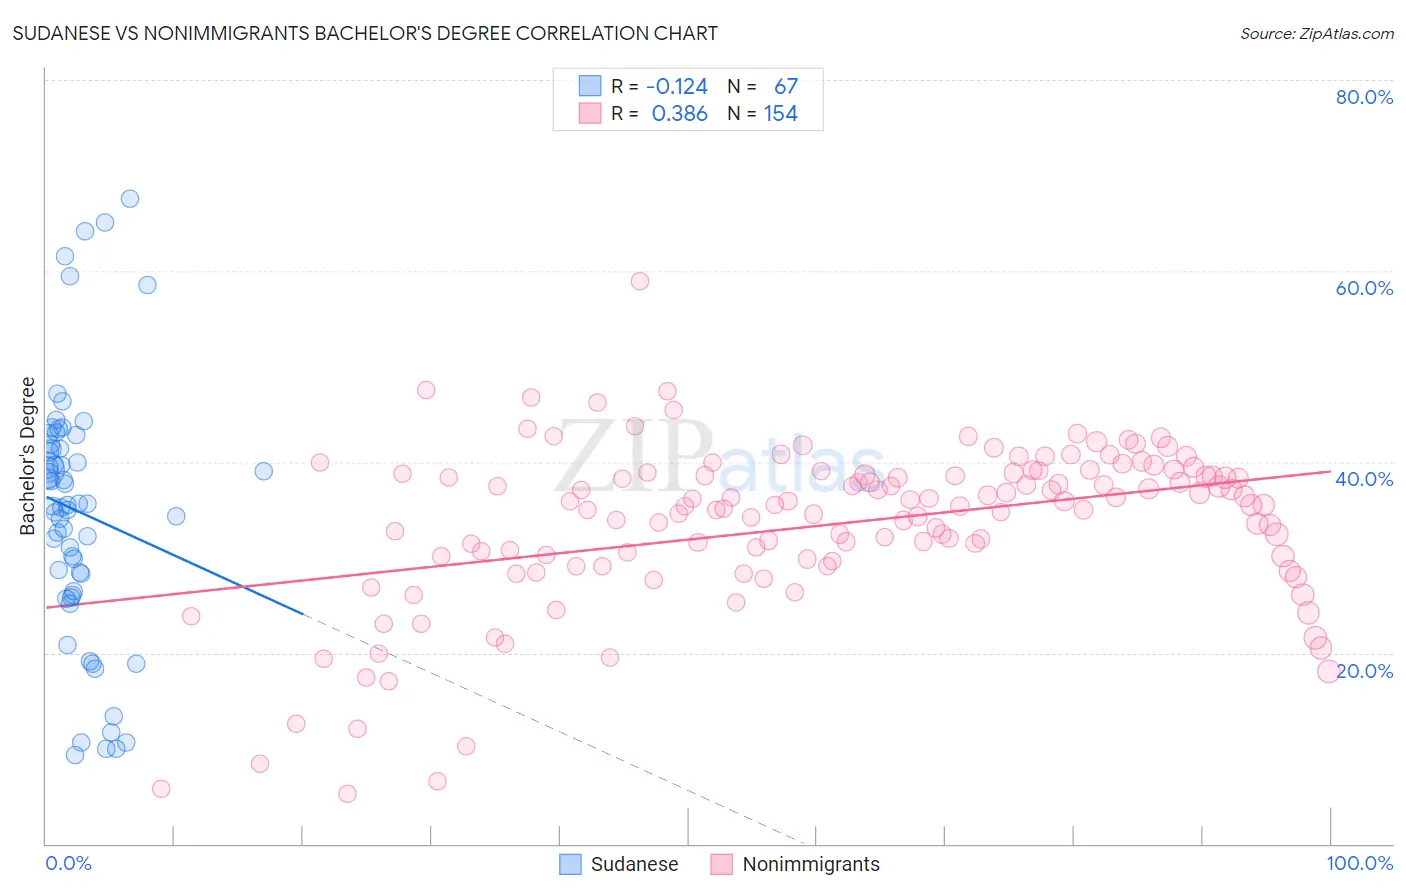
Sudanese vs Nonimmigrants Bachelor's Degree Correlation Chart
The statistical analysis conducted on geographies consisting of 110,140,841 people shows a poor negative correlation between the proportion of Sudanese and percentage of population with at least bachelor's degree education in the United States with a correlation coefficient (R) of -0.124 and weighted average of 38.9%. Similarly, the statistical analysis conducted on geographies consisting of 584,797,512 people shows a mild positive correlation between the proportion of Nonimmigrants and percentage of population with at least bachelor's degree education in the United States with a correlation coefficient (R) of 0.386 and weighted average of 34.2%, a difference of 13.9%.
Bachelor's Degree Correlation Summary
| Measurement | Sudanese | Nonimmigrants |
| Minimum | 9.3% | 5.2% |
| Maximum | 67.6% | 58.9% |
| Range | 58.3% | 53.7% |
| Mean | 34.8% | 33.4% |
| Median | 35.5% | 35.5% |
| Interquartile 25% (IQ1) | 26.5% | 29.8% |
| Interquartile 75% (IQ3) | 41.8% | 38.6% |
| Interquartile Range (IQR) | 15.3% | 8.9% |
| Standard Deviation (Sample) | 13.4% | 8.6% |
| Standard Deviation (Population) | 13.3% | 8.6% |
Similar Demographics by Bachelor's Degree
Demographics Similar to Sudanese by Bachelor's Degree
In terms of bachelor's degree, the demographic groups most similar to Sudanese are Immigrants from Africa (38.9%, a difference of 0.020%), Slavic (38.9%, a difference of 0.060%), South American (38.9%, a difference of 0.12%), Immigrants from Poland (39.0%, a difference of 0.15%), and Canadian (38.8%, a difference of 0.18%).
| Demographics | Rating | Rank | Bachelor's Degree |
| Slovenes | 79.5 /100 | #145 | Good 39.1% |
| Swedes | 79.2 /100 | #146 | Good 39.1% |
| Immigrants | Sierra Leone | 79.0 /100 | #147 | Good 39.0% |
| Iraqis | 78.1 /100 | #148 | Good 39.0% |
| Immigrants | Poland | 77.5 /100 | #149 | Good 39.0% |
| South Americans | 77.3 /100 | #150 | Good 38.9% |
| Immigrants | Africa | 76.5 /100 | #151 | Good 38.9% |
| Sudanese | 76.4 /100 | #152 | Good 38.9% |
| Slavs | 75.9 /100 | #153 | Good 38.9% |
| Canadians | 75.0 /100 | #154 | Good 38.8% |
| Immigrants | Kenya | 73.8 /100 | #155 | Good 38.8% |
| Kenyans | 72.5 /100 | #156 | Good 38.7% |
| Immigrants | South America | 70.1 /100 | #157 | Good 38.6% |
| Immigrants | Germany | 69.6 /100 | #158 | Good 38.6% |
| Chinese | 66.6 /100 | #159 | Good 38.5% |
Demographics Similar to Nonimmigrants by Bachelor's Degree
In terms of bachelor's degree, the demographic groups most similar to Nonimmigrants are Immigrants from Cambodia (34.2%, a difference of 0.060%), Tongan (34.3%, a difference of 0.33%), Immigrants from Guyana (33.9%, a difference of 0.64%), British West Indian (34.5%, a difference of 0.87%), and Guyanese (34.5%, a difference of 0.89%).
| Demographics | Rating | Rank | Bachelor's Degree |
| Immigrants | West Indies | 2.9 /100 | #235 | Tragic 34.6% |
| Liberians | 2.8 /100 | #236 | Tragic 34.6% |
| Tlingit-Haida | 2.8 /100 | #237 | Tragic 34.6% |
| Guyanese | 2.5 /100 | #238 | Tragic 34.5% |
| British West Indians | 2.5 /100 | #239 | Tragic 34.5% |
| Tongans | 2.0 /100 | #240 | Tragic 34.3% |
| Immigrants | Cambodia | 1.9 /100 | #241 | Tragic 34.2% |
| Immigrants | Nonimmigrants | 1.8 /100 | #242 | Tragic 34.2% |
| Immigrants | Guyana | 1.4 /100 | #243 | Tragic 33.9% |
| Delaware | 1.2 /100 | #244 | Tragic 33.8% |
| Immigrants | Fiji | 1.2 /100 | #245 | Tragic 33.7% |
| Jamaicans | 1.0 /100 | #246 | Tragic 33.6% |
| Immigrants | Congo | 1.0 /100 | #247 | Tragic 33.6% |
| Cree | 1.0 /100 | #248 | Tragic 33.6% |
| Immigrants | Liberia | 0.9 /100 | #249 | Tragic 33.5% |