Immigrants from Middle Africa vs Nonimmigrants Bachelor's Degree
COMPARE
Immigrants from Middle Africa
Nonimmigrants
Bachelor's Degree
Bachelor's Degree Comparison
Immigrants from Middle Africa
Nonimmigrants
36.6%
BACHELOR'S DEGREE
20.6/ 100
METRIC RATING
207th/ 347
METRIC RANK
34.2%
BACHELOR'S DEGREE
1.8/ 100
METRIC RATING
242nd/ 347
METRIC RANK
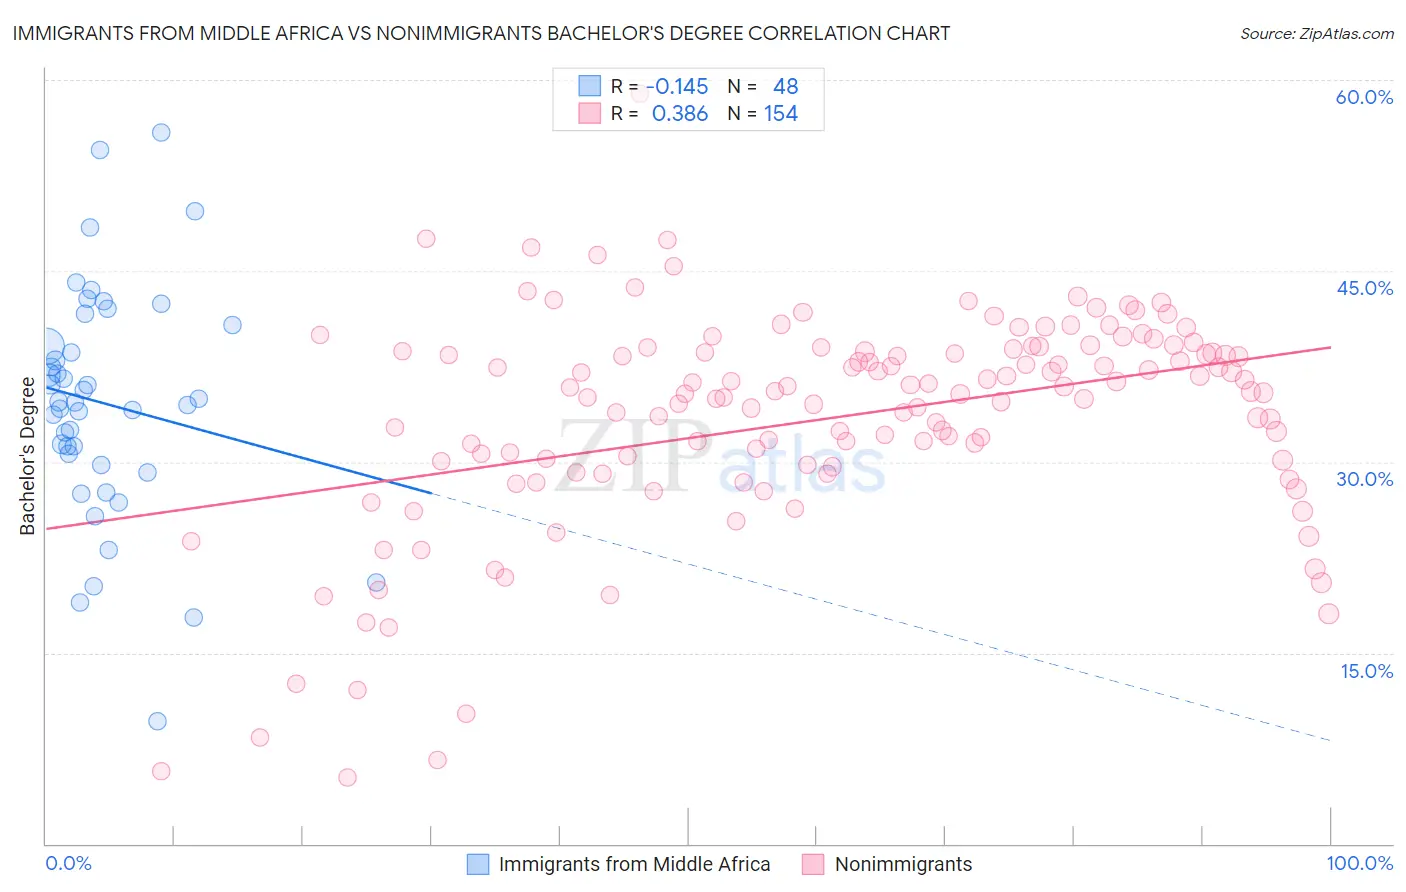
Immigrants from Middle Africa vs Nonimmigrants Bachelor's Degree Correlation Chart
The statistical analysis conducted on geographies consisting of 202,742,104 people shows a poor negative correlation between the proportion of Immigrants from Middle Africa and percentage of population with at least bachelor's degree education in the United States with a correlation coefficient (R) of -0.145 and weighted average of 36.6%. Similarly, the statistical analysis conducted on geographies consisting of 584,797,512 people shows a mild positive correlation between the proportion of Nonimmigrants and percentage of population with at least bachelor's degree education in the United States with a correlation coefficient (R) of 0.386 and weighted average of 34.2%, a difference of 7.1%.
Bachelor's Degree Correlation Summary
| Measurement | Immigrants from Middle Africa | Nonimmigrants |
| Minimum | 9.6% | 5.2% |
| Maximum | 55.9% | 58.9% |
| Range | 46.3% | 53.7% |
| Mean | 34.6% | 33.4% |
| Median | 34.7% | 35.5% |
| Interquartile 25% (IQ1) | 30.2% | 29.8% |
| Interquartile 75% (IQ3) | 39.9% | 38.6% |
| Interquartile Range (IQR) | 9.7% | 8.9% |
| Standard Deviation (Sample) | 9.1% | 8.6% |
| Standard Deviation (Population) | 9.0% | 8.6% |
Similar Demographics by Bachelor's Degree
Demographics Similar to Immigrants from Middle Africa by Bachelor's Degree
In terms of bachelor's degree, the demographic groups most similar to Immigrants from Middle Africa are Spaniard (36.6%, a difference of 0.090%), Immigrants from Thailand (36.5%, a difference of 0.19%), Finnish (36.7%, a difference of 0.23%), Panamanian (36.5%, a difference of 0.30%), and French (36.5%, a difference of 0.32%).
| Demographics | Rating | Rank | Bachelor's Degree |
| Immigrants | Ghana | 27.4 /100 | #200 | Fair 36.9% |
| Immigrants | South Eastern Asia | 25.4 /100 | #201 | Fair 36.8% |
| Immigrants | Zaire | 25.3 /100 | #202 | Fair 36.8% |
| Immigrants | Nigeria | 23.1 /100 | #203 | Fair 36.7% |
| Immigrants | Immigrants | 22.8 /100 | #204 | Fair 36.7% |
| Finns | 22.2 /100 | #205 | Fair 36.7% |
| Spaniards | 21.2 /100 | #206 | Fair 36.6% |
| Immigrants | Middle Africa | 20.6 /100 | #207 | Fair 36.6% |
| Immigrants | Thailand | 19.4 /100 | #208 | Poor 36.5% |
| Panamanians | 18.8 /100 | #209 | Poor 36.5% |
| French | 18.6 /100 | #210 | Poor 36.5% |
| Scotch-Irish | 18.3 /100 | #211 | Poor 36.4% |
| Immigrants | Philippines | 17.8 /100 | #212 | Poor 36.4% |
| Immigrants | Panama | 14.2 /100 | #213 | Poor 36.2% |
| Germans | 13.9 /100 | #214 | Poor 36.1% |
Demographics Similar to Nonimmigrants by Bachelor's Degree
In terms of bachelor's degree, the demographic groups most similar to Nonimmigrants are Immigrants from Cambodia (34.2%, a difference of 0.060%), Tongan (34.3%, a difference of 0.33%), Immigrants from Guyana (33.9%, a difference of 0.64%), British West Indian (34.5%, a difference of 0.87%), and Guyanese (34.5%, a difference of 0.89%).
| Demographics | Rating | Rank | Bachelor's Degree |
| Immigrants | West Indies | 2.9 /100 | #235 | Tragic 34.6% |
| Liberians | 2.8 /100 | #236 | Tragic 34.6% |
| Tlingit-Haida | 2.8 /100 | #237 | Tragic 34.6% |
| Guyanese | 2.5 /100 | #238 | Tragic 34.5% |
| British West Indians | 2.5 /100 | #239 | Tragic 34.5% |
| Tongans | 2.0 /100 | #240 | Tragic 34.3% |
| Immigrants | Cambodia | 1.9 /100 | #241 | Tragic 34.2% |
| Immigrants | Nonimmigrants | 1.8 /100 | #242 | Tragic 34.2% |
| Immigrants | Guyana | 1.4 /100 | #243 | Tragic 33.9% |
| Delaware | 1.2 /100 | #244 | Tragic 33.8% |
| Immigrants | Fiji | 1.2 /100 | #245 | Tragic 33.7% |
| Jamaicans | 1.0 /100 | #246 | Tragic 33.6% |
| Immigrants | Congo | 1.0 /100 | #247 | Tragic 33.6% |
| Cree | 1.0 /100 | #248 | Tragic 33.6% |
| Immigrants | Liberia | 0.9 /100 | #249 | Tragic 33.5% |