Sudanese vs Icelander Bachelor's Degree
COMPARE
Sudanese
Icelander
Bachelor's Degree
Bachelor's Degree Comparison
Sudanese
Icelanders
38.9%
BACHELOR'S DEGREE
76.4/ 100
METRIC RATING
152nd/ 347
METRIC RANK
39.5%
BACHELOR'S DEGREE
86.5/ 100
METRIC RATING
137th/ 347
METRIC RANK
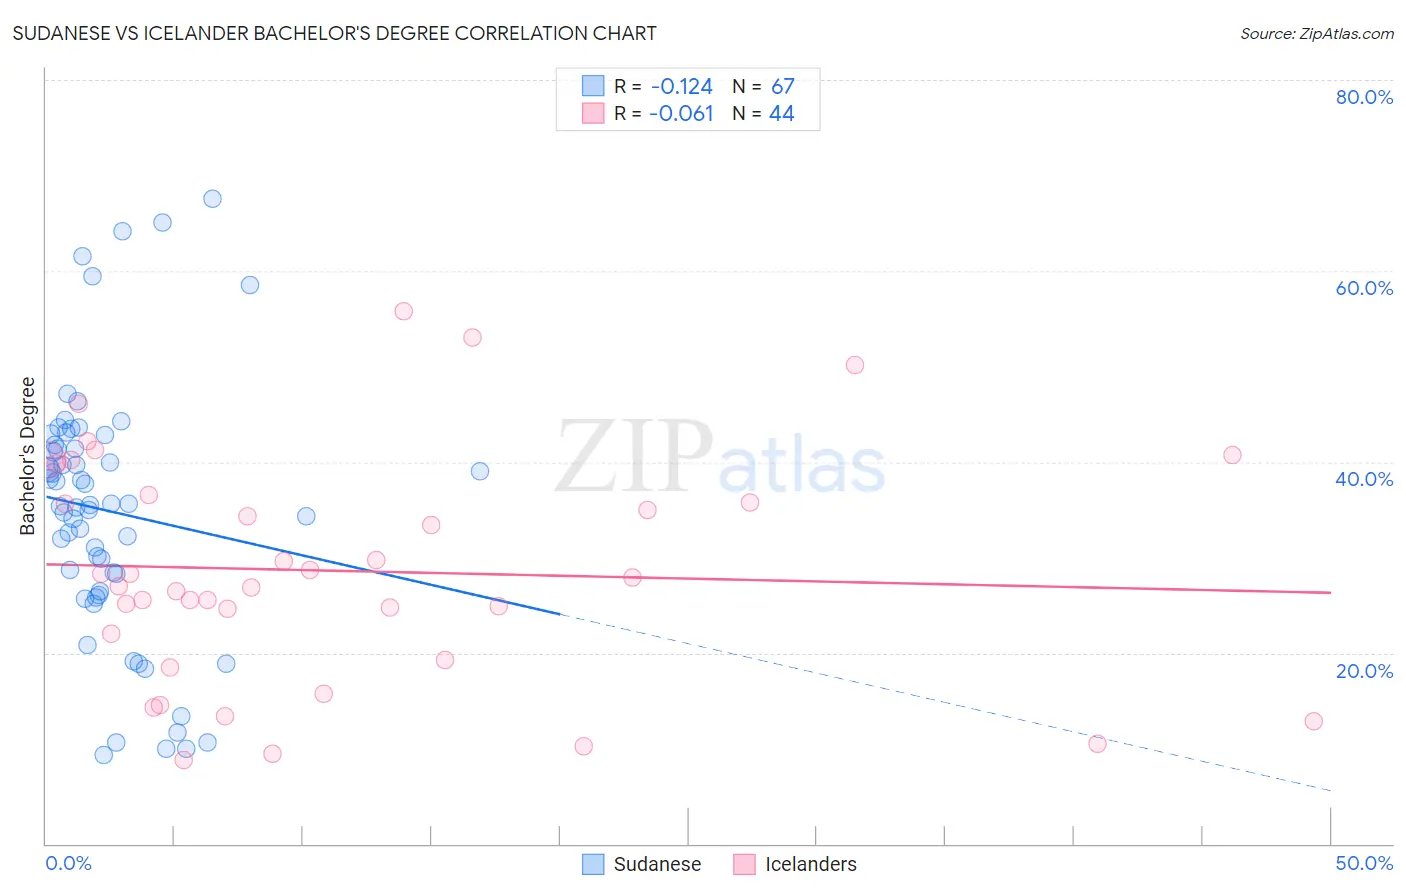
Sudanese vs Icelander Bachelor's Degree Correlation Chart
The statistical analysis conducted on geographies consisting of 110,140,841 people shows a poor negative correlation between the proportion of Sudanese and percentage of population with at least bachelor's degree education in the United States with a correlation coefficient (R) of -0.124 and weighted average of 38.9%. Similarly, the statistical analysis conducted on geographies consisting of 159,661,009 people shows a slight negative correlation between the proportion of Icelanders and percentage of population with at least bachelor's degree education in the United States with a correlation coefficient (R) of -0.061 and weighted average of 39.5%, a difference of 1.6%.
Bachelor's Degree Correlation Summary
| Measurement | Sudanese | Icelander |
| Minimum | 9.3% | 8.8% |
| Maximum | 67.6% | 55.7% |
| Range | 58.3% | 47.0% |
| Mean | 34.8% | 28.6% |
| Median | 35.5% | 27.4% |
| Interquartile 25% (IQ1) | 26.5% | 20.6% |
| Interquartile 75% (IQ3) | 41.8% | 36.1% |
| Interquartile Range (IQR) | 15.3% | 15.5% |
| Standard Deviation (Sample) | 13.4% | 11.9% |
| Standard Deviation (Population) | 13.3% | 11.7% |
Demographics Similar to Sudanese and Icelanders by Bachelor's Degree
In terms of bachelor's degree, the demographic groups most similar to Sudanese are Immigrants from Africa (38.9%, a difference of 0.020%), Slavic (38.9%, a difference of 0.060%), South American (38.9%, a difference of 0.12%), Immigrants from Poland (39.0%, a difference of 0.15%), and Canadian (38.8%, a difference of 0.18%). Similarly, the demographic groups most similar to Icelanders are European (39.5%, a difference of 0.17%), Pakistani (39.7%, a difference of 0.37%), Immigrants from Sudan (39.4%, a difference of 0.37%), Immigrants from Armenia (39.4%, a difference of 0.44%), and South American Indian (39.3%, a difference of 0.53%).
| Demographics | Rating | Rank | Bachelor's Degree |
| Assyrians/Chaldeans/Syriacs | 89.4 /100 | #134 | Excellent 39.8% |
| Luxembourgers | 89.1 /100 | #135 | Excellent 39.8% |
| Pakistanis | 88.2 /100 | #136 | Excellent 39.7% |
| Icelanders | 86.5 /100 | #137 | Excellent 39.5% |
| Europeans | 85.6 /100 | #138 | Excellent 39.5% |
| Immigrants | Sudan | 84.5 /100 | #139 | Excellent 39.4% |
| Immigrants | Armenia | 84.1 /100 | #140 | Excellent 39.4% |
| South American Indians | 83.6 /100 | #141 | Excellent 39.3% |
| Immigrants | North Macedonia | 81.6 /100 | #142 | Excellent 39.2% |
| Poles | 79.8 /100 | #143 | Good 39.1% |
| Immigrants | Afghanistan | 79.7 /100 | #144 | Good 39.1% |
| Slovenes | 79.5 /100 | #145 | Good 39.1% |
| Swedes | 79.2 /100 | #146 | Good 39.1% |
| Immigrants | Sierra Leone | 79.0 /100 | #147 | Good 39.0% |
| Iraqis | 78.1 /100 | #148 | Good 39.0% |
| Immigrants | Poland | 77.5 /100 | #149 | Good 39.0% |
| South Americans | 77.3 /100 | #150 | Good 38.9% |
| Immigrants | Africa | 76.5 /100 | #151 | Good 38.9% |
| Sudanese | 76.4 /100 | #152 | Good 38.9% |
| Slavs | 75.9 /100 | #153 | Good 38.9% |
| Canadians | 75.0 /100 | #154 | Good 38.8% |