Blackfeet vs Nonimmigrants Bachelor's Degree
COMPARE
Blackfeet
Nonimmigrants
Bachelor's Degree
Bachelor's Degree Comparison
Blackfeet
Nonimmigrants
31.5%
BACHELOR'S DEGREE
0.1/ 100
METRIC RATING
281st/ 347
METRIC RANK
34.2%
BACHELOR'S DEGREE
1.8/ 100
METRIC RATING
242nd/ 347
METRIC RANK
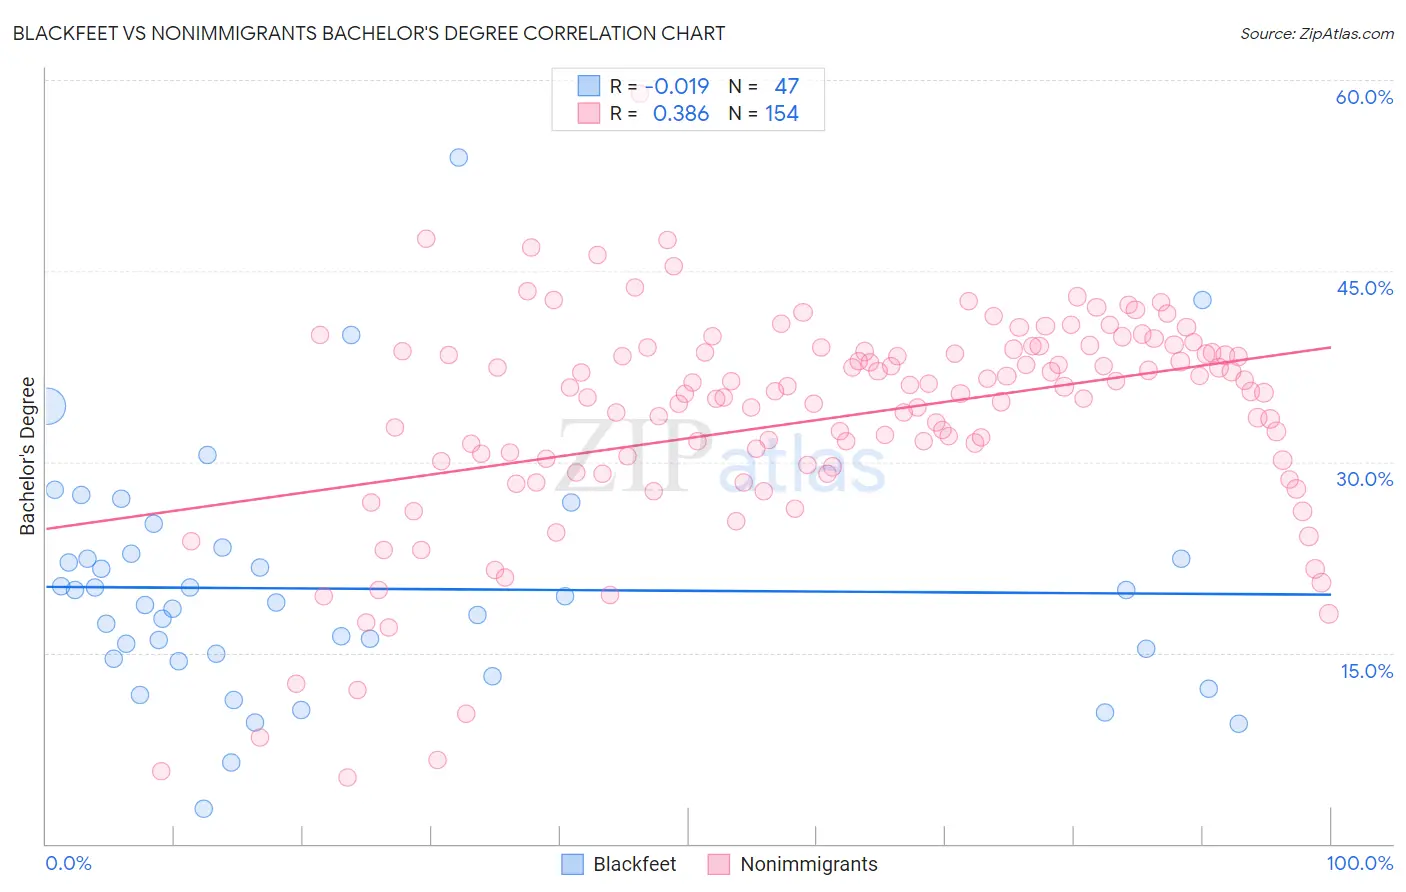
Blackfeet vs Nonimmigrants Bachelor's Degree Correlation Chart
The statistical analysis conducted on geographies consisting of 309,572,502 people shows no correlation between the proportion of Blackfeet and percentage of population with at least bachelor's degree education in the United States with a correlation coefficient (R) of -0.019 and weighted average of 31.5%. Similarly, the statistical analysis conducted on geographies consisting of 584,797,512 people shows a mild positive correlation between the proportion of Nonimmigrants and percentage of population with at least bachelor's degree education in the United States with a correlation coefficient (R) of 0.386 and weighted average of 34.2%, a difference of 8.6%.
Bachelor's Degree Correlation Summary
| Measurement | Blackfeet | Nonimmigrants |
| Minimum | 2.7% | 5.2% |
| Maximum | 53.9% | 58.9% |
| Range | 51.2% | 53.7% |
| Mean | 20.0% | 33.4% |
| Median | 18.9% | 35.5% |
| Interquartile 25% (IQ1) | 14.5% | 29.8% |
| Interquartile 75% (IQ3) | 22.7% | 38.6% |
| Interquartile Range (IQR) | 8.2% | 8.9% |
| Standard Deviation (Sample) | 9.3% | 8.6% |
| Standard Deviation (Population) | 9.2% | 8.6% |
Similar Demographics by Bachelor's Degree
Demographics Similar to Blackfeet by Bachelor's Degree
In terms of bachelor's degree, the demographic groups most similar to Blackfeet are Immigrants from Caribbean (31.4%, a difference of 0.15%), Honduran (31.3%, a difference of 0.42%), Haitian (31.3%, a difference of 0.45%), Immigrants from Laos (31.6%, a difference of 0.46%), and Aleut (31.3%, a difference of 0.47%).
| Demographics | Rating | Rank | Bachelor's Degree |
| Potawatomi | 0.2 /100 | #274 | Tragic 31.9% |
| Samoans | 0.1 /100 | #275 | Tragic 31.8% |
| Salvadorans | 0.1 /100 | #276 | Tragic 31.8% |
| Dominicans | 0.1 /100 | #277 | Tragic 31.8% |
| Marshallese | 0.1 /100 | #278 | Tragic 31.7% |
| Hawaiians | 0.1 /100 | #279 | Tragic 31.6% |
| Immigrants | Laos | 0.1 /100 | #280 | Tragic 31.6% |
| Blackfeet | 0.1 /100 | #281 | Tragic 31.5% |
| Immigrants | Caribbean | 0.1 /100 | #282 | Tragic 31.4% |
| Hondurans | 0.1 /100 | #283 | Tragic 31.3% |
| Haitians | 0.1 /100 | #284 | Tragic 31.3% |
| Aleuts | 0.1 /100 | #285 | Tragic 31.3% |
| Immigrants | El Salvador | 0.1 /100 | #286 | Tragic 31.3% |
| Ottawa | 0.1 /100 | #287 | Tragic 31.1% |
| Guatemalans | 0.1 /100 | #288 | Tragic 31.0% |
Demographics Similar to Nonimmigrants by Bachelor's Degree
In terms of bachelor's degree, the demographic groups most similar to Nonimmigrants are Immigrants from Cambodia (34.2%, a difference of 0.060%), Tongan (34.3%, a difference of 0.33%), Immigrants from Guyana (33.9%, a difference of 0.64%), British West Indian (34.5%, a difference of 0.87%), and Guyanese (34.5%, a difference of 0.89%).
| Demographics | Rating | Rank | Bachelor's Degree |
| Immigrants | West Indies | 2.9 /100 | #235 | Tragic 34.6% |
| Liberians | 2.8 /100 | #236 | Tragic 34.6% |
| Tlingit-Haida | 2.8 /100 | #237 | Tragic 34.6% |
| Guyanese | 2.5 /100 | #238 | Tragic 34.5% |
| British West Indians | 2.5 /100 | #239 | Tragic 34.5% |
| Tongans | 2.0 /100 | #240 | Tragic 34.3% |
| Immigrants | Cambodia | 1.9 /100 | #241 | Tragic 34.2% |
| Immigrants | Nonimmigrants | 1.8 /100 | #242 | Tragic 34.2% |
| Immigrants | Guyana | 1.4 /100 | #243 | Tragic 33.9% |
| Delaware | 1.2 /100 | #244 | Tragic 33.8% |
| Immigrants | Fiji | 1.2 /100 | #245 | Tragic 33.7% |
| Jamaicans | 1.0 /100 | #246 | Tragic 33.6% |
| Immigrants | Congo | 1.0 /100 | #247 | Tragic 33.6% |
| Cree | 1.0 /100 | #248 | Tragic 33.6% |
| Immigrants | Liberia | 0.9 /100 | #249 | Tragic 33.5% |