Sudanese vs Laotian Master's Degree
COMPARE
Sudanese
Laotian
Master's Degree
Master's Degree Comparison
Sudanese
Laotians
15.3%
MASTER'S DEGREE
68.7/ 100
METRIC RATING
161st/ 347
METRIC RANK
17.0%
MASTER'S DEGREE
98.8/ 100
METRIC RATING
99th/ 347
METRIC RANK
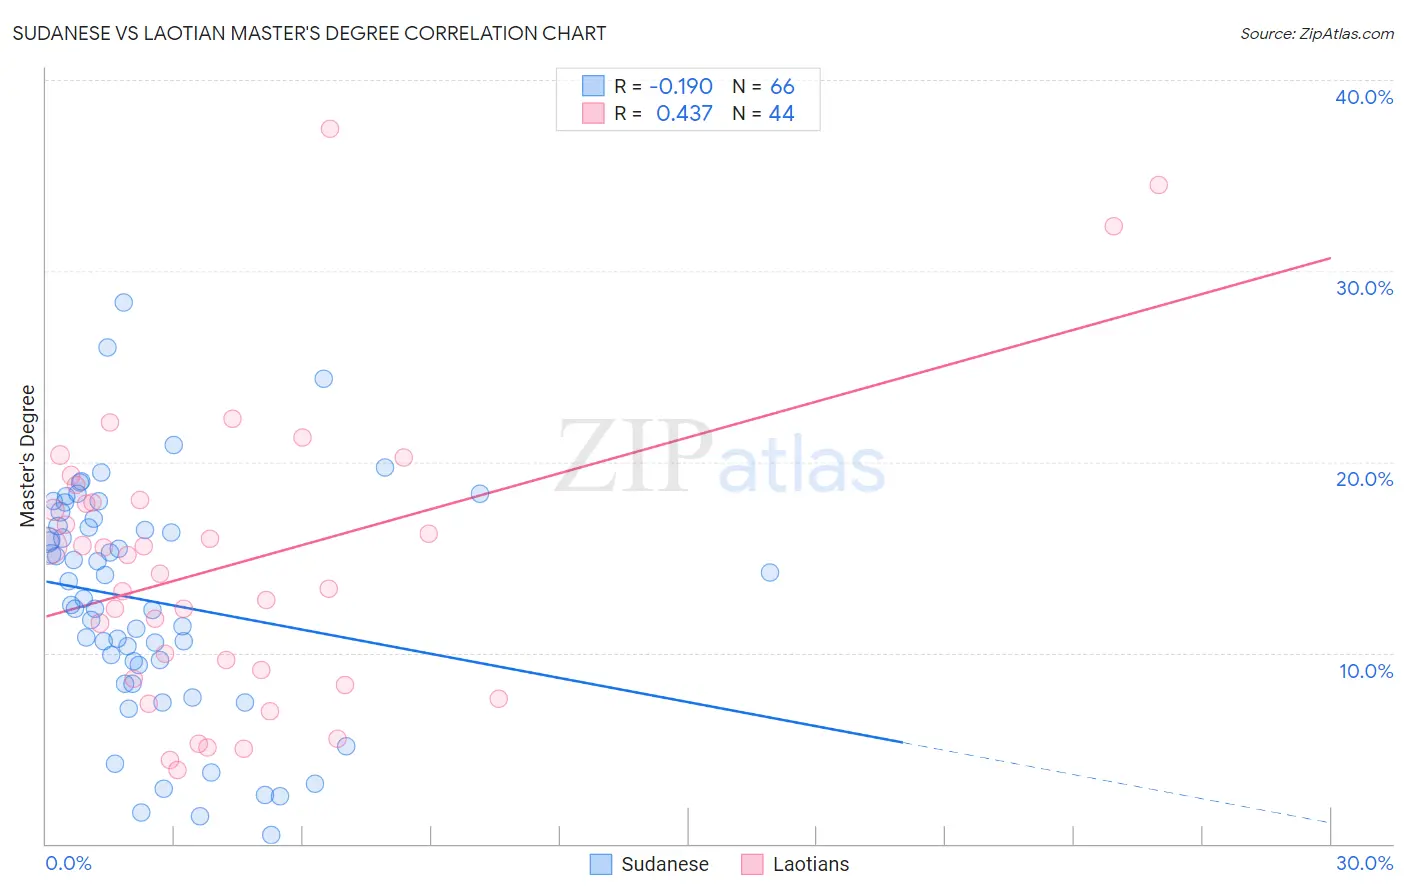
Sudanese vs Laotian Master's Degree Correlation Chart
The statistical analysis conducted on geographies consisting of 110,110,663 people shows a poor negative correlation between the proportion of Sudanese and percentage of population with at least master's degree education in the United States with a correlation coefficient (R) of -0.190 and weighted average of 15.3%. Similarly, the statistical analysis conducted on geographies consisting of 224,808,170 people shows a moderate positive correlation between the proportion of Laotians and percentage of population with at least master's degree education in the United States with a correlation coefficient (R) of 0.437 and weighted average of 17.0%, a difference of 11.3%.
Master's Degree Correlation Summary
| Measurement | Sudanese | Laotian |
| Minimum | 0.44% | 3.9% |
| Maximum | 28.3% | 37.4% |
| Range | 27.9% | 33.6% |
| Mean | 12.7% | 14.6% |
| Median | 12.7% | 14.6% |
| Interquartile 25% (IQ1) | 9.3% | 8.9% |
| Interquartile 75% (IQ3) | 16.6% | 17.9% |
| Interquartile Range (IQR) | 7.3% | 9.1% |
| Standard Deviation (Sample) | 6.0% | 7.6% |
| Standard Deviation (Population) | 6.0% | 7.5% |
Similar Demographics by Master's Degree
Demographics Similar to Sudanese by Master's Degree
In terms of master's degree, the demographic groups most similar to Sudanese are Peruvian (15.3%, a difference of 0.010%), Kenyan (15.3%, a difference of 0.23%), Uruguayan (15.3%, a difference of 0.23%), Colombian (15.3%, a difference of 0.26%), and Immigrants from Kenya (15.3%, a difference of 0.30%).
| Demographics | Rating | Rank | Master's Degree |
| Immigrants | South America | 76.3 /100 | #154 | Good 15.5% |
| Immigrants | Bangladesh | 76.1 /100 | #155 | Good 15.5% |
| Bermudans | 73.9 /100 | #156 | Good 15.4% |
| Immigrants | Cameroon | 71.7 /100 | #157 | Good 15.4% |
| Immigrants | Poland | 71.5 /100 | #158 | Good 15.4% |
| Luxembourgers | 71.0 /100 | #159 | Good 15.3% |
| Kenyans | 70.3 /100 | #160 | Good 15.3% |
| Sudanese | 68.7 /100 | #161 | Good 15.3% |
| Peruvians | 68.7 /100 | #162 | Good 15.3% |
| Uruguayans | 67.1 /100 | #163 | Good 15.3% |
| Colombians | 66.9 /100 | #164 | Good 15.3% |
| Immigrants | Kenya | 66.6 /100 | #165 | Good 15.3% |
| Swedes | 66.1 /100 | #166 | Good 15.2% |
| Senegalese | 65.6 /100 | #167 | Good 15.2% |
| Immigrants | North Macedonia | 64.5 /100 | #168 | Good 15.2% |
Demographics Similar to Laotians by Master's Degree
In terms of master's degree, the demographic groups most similar to Laotians are Immigrants from Ukraine (17.0%, a difference of 0.060%), Immigrants from England (17.0%, a difference of 0.15%), Albanian (17.0%, a difference of 0.21%), Immigrants from Northern Africa (17.1%, a difference of 0.32%), and Immigrants from Morocco (17.1%, a difference of 0.35%).
| Demographics | Rating | Rank | Master's Degree |
| Immigrants | North America | 99.1 /100 | #92 | Exceptional 17.2% |
| Immigrants | Italy | 99.1 /100 | #93 | Exceptional 17.2% |
| Ugandans | 99.0 /100 | #94 | Exceptional 17.1% |
| Immigrants | Morocco | 98.9 /100 | #95 | Exceptional 17.1% |
| Immigrants | Northern Africa | 98.9 /100 | #96 | Exceptional 17.1% |
| Immigrants | England | 98.8 /100 | #97 | Exceptional 17.0% |
| Immigrants | Ukraine | 98.8 /100 | #98 | Exceptional 17.0% |
| Laotians | 98.8 /100 | #99 | Exceptional 17.0% |
| Albanians | 98.7 /100 | #100 | Exceptional 17.0% |
| Immigrants | Nepal | 98.6 /100 | #101 | Exceptional 17.0% |
| Chileans | 98.6 /100 | #102 | Exceptional 16.9% |
| Alsatians | 98.4 /100 | #103 | Exceptional 16.9% |
| Ukrainians | 98.3 /100 | #104 | Exceptional 16.9% |
| Syrians | 98.3 /100 | #105 | Exceptional 16.8% |
| Immigrants | Albania | 98.1 /100 | #106 | Exceptional 16.8% |