Sudanese vs Immigrants from Turkey Master's Degree
COMPARE
Sudanese
Immigrants from Turkey
Master's Degree
Master's Degree Comparison
Sudanese
Immigrants from Turkey
15.3%
MASTER'S DEGREE
68.7/ 100
METRIC RATING
161st/ 347
METRIC RANK
19.7%
MASTER'S DEGREE
100.0/ 100
METRIC RATING
30th/ 347
METRIC RANK
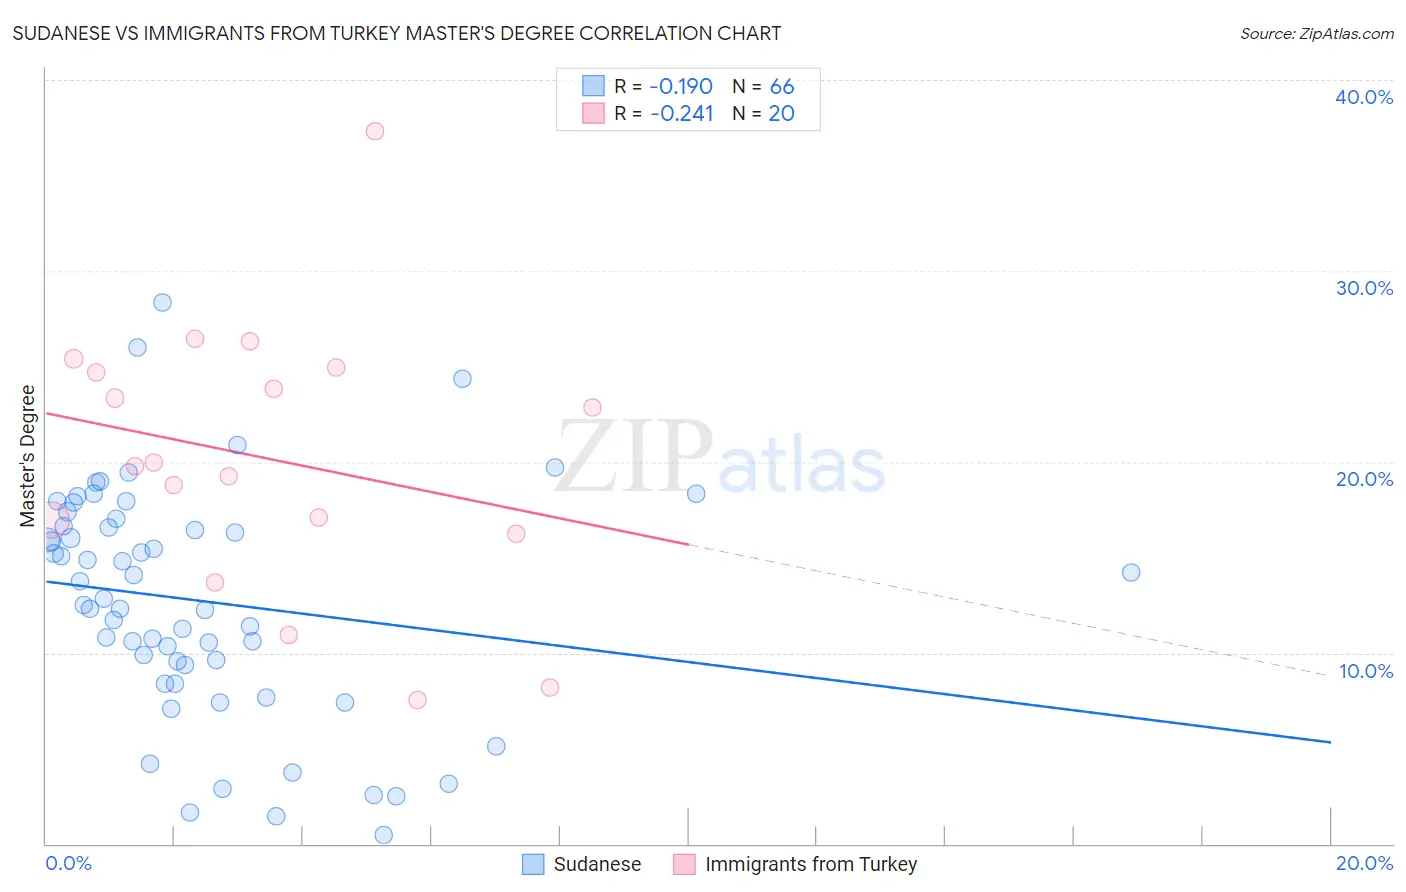
Sudanese vs Immigrants from Turkey Master's Degree Correlation Chart
The statistical analysis conducted on geographies consisting of 110,110,663 people shows a poor negative correlation between the proportion of Sudanese and percentage of population with at least master's degree education in the United States with a correlation coefficient (R) of -0.190 and weighted average of 15.3%. Similarly, the statistical analysis conducted on geographies consisting of 223,018,840 people shows a weak negative correlation between the proportion of Immigrants from Turkey and percentage of population with at least master's degree education in the United States with a correlation coefficient (R) of -0.241 and weighted average of 19.7%, a difference of 28.9%.
Master's Degree Correlation Summary
| Measurement | Sudanese | Immigrants from Turkey |
| Minimum | 0.44% | 7.6% |
| Maximum | 28.3% | 37.3% |
| Range | 27.9% | 29.8% |
| Mean | 12.7% | 20.2% |
| Median | 12.7% | 19.9% |
| Interquartile 25% (IQ1) | 9.3% | 16.6% |
| Interquartile 75% (IQ3) | 16.6% | 24.8% |
| Interquartile Range (IQR) | 7.3% | 8.2% |
| Standard Deviation (Sample) | 6.0% | 7.0% |
| Standard Deviation (Population) | 6.0% | 6.9% |
Similar Demographics by Master's Degree
Demographics Similar to Sudanese by Master's Degree
In terms of master's degree, the demographic groups most similar to Sudanese are Peruvian (15.3%, a difference of 0.010%), Kenyan (15.3%, a difference of 0.23%), Uruguayan (15.3%, a difference of 0.23%), Colombian (15.3%, a difference of 0.26%), and Immigrants from Kenya (15.3%, a difference of 0.30%).
| Demographics | Rating | Rank | Master's Degree |
| Immigrants | South America | 76.3 /100 | #154 | Good 15.5% |
| Immigrants | Bangladesh | 76.1 /100 | #155 | Good 15.5% |
| Bermudans | 73.9 /100 | #156 | Good 15.4% |
| Immigrants | Cameroon | 71.7 /100 | #157 | Good 15.4% |
| Immigrants | Poland | 71.5 /100 | #158 | Good 15.4% |
| Luxembourgers | 71.0 /100 | #159 | Good 15.3% |
| Kenyans | 70.3 /100 | #160 | Good 15.3% |
| Sudanese | 68.7 /100 | #161 | Good 15.3% |
| Peruvians | 68.7 /100 | #162 | Good 15.3% |
| Uruguayans | 67.1 /100 | #163 | Good 15.3% |
| Colombians | 66.9 /100 | #164 | Good 15.3% |
| Immigrants | Kenya | 66.6 /100 | #165 | Good 15.3% |
| Swedes | 66.1 /100 | #166 | Good 15.2% |
| Senegalese | 65.6 /100 | #167 | Good 15.2% |
| Immigrants | North Macedonia | 64.5 /100 | #168 | Good 15.2% |
Demographics Similar to Immigrants from Turkey by Master's Degree
In terms of master's degree, the demographic groups most similar to Immigrants from Turkey are Immigrants from Korea (19.7%, a difference of 0.010%), Burmese (19.7%, a difference of 0.080%), Latvian (19.8%, a difference of 0.50%), Russian (19.5%, a difference of 0.86%), and Immigrants from Denmark (19.5%, a difference of 0.89%).
| Demographics | Rating | Rank | Master's Degree |
| Immigrants | France | 100.0 /100 | #23 | Exceptional 20.3% |
| Immigrants | Sweden | 100.0 /100 | #24 | Exceptional 20.3% |
| Immigrants | Japan | 100.0 /100 | #25 | Exceptional 20.0% |
| Cambodians | 100.0 /100 | #26 | Exceptional 20.0% |
| Immigrants | Sri Lanka | 100.0 /100 | #27 | Exceptional 19.9% |
| Turks | 100.0 /100 | #28 | Exceptional 19.9% |
| Latvians | 100.0 /100 | #29 | Exceptional 19.8% |
| Immigrants | Turkey | 100.0 /100 | #30 | Exceptional 19.7% |
| Immigrants | Korea | 100.0 /100 | #31 | Exceptional 19.7% |
| Burmese | 100.0 /100 | #32 | Exceptional 19.7% |
| Russians | 100.0 /100 | #33 | Exceptional 19.5% |
| Immigrants | Denmark | 100.0 /100 | #34 | Exceptional 19.5% |
| Immigrants | Northern Europe | 100.0 /100 | #35 | Exceptional 19.5% |
| Immigrants | Russia | 100.0 /100 | #36 | Exceptional 19.4% |
| Mongolians | 100.0 /100 | #37 | Exceptional 19.4% |