Sudanese vs Native/Alaskan Master's Degree
COMPARE
Sudanese
Native/Alaskan
Master's Degree
Master's Degree Comparison
Sudanese
Natives/Alaskans
15.3%
MASTER'S DEGREE
68.7/ 100
METRIC RATING
161st/ 347
METRIC RANK
9.9%
MASTER'S DEGREE
0.0/ 100
METRIC RATING
336th/ 347
METRIC RANK
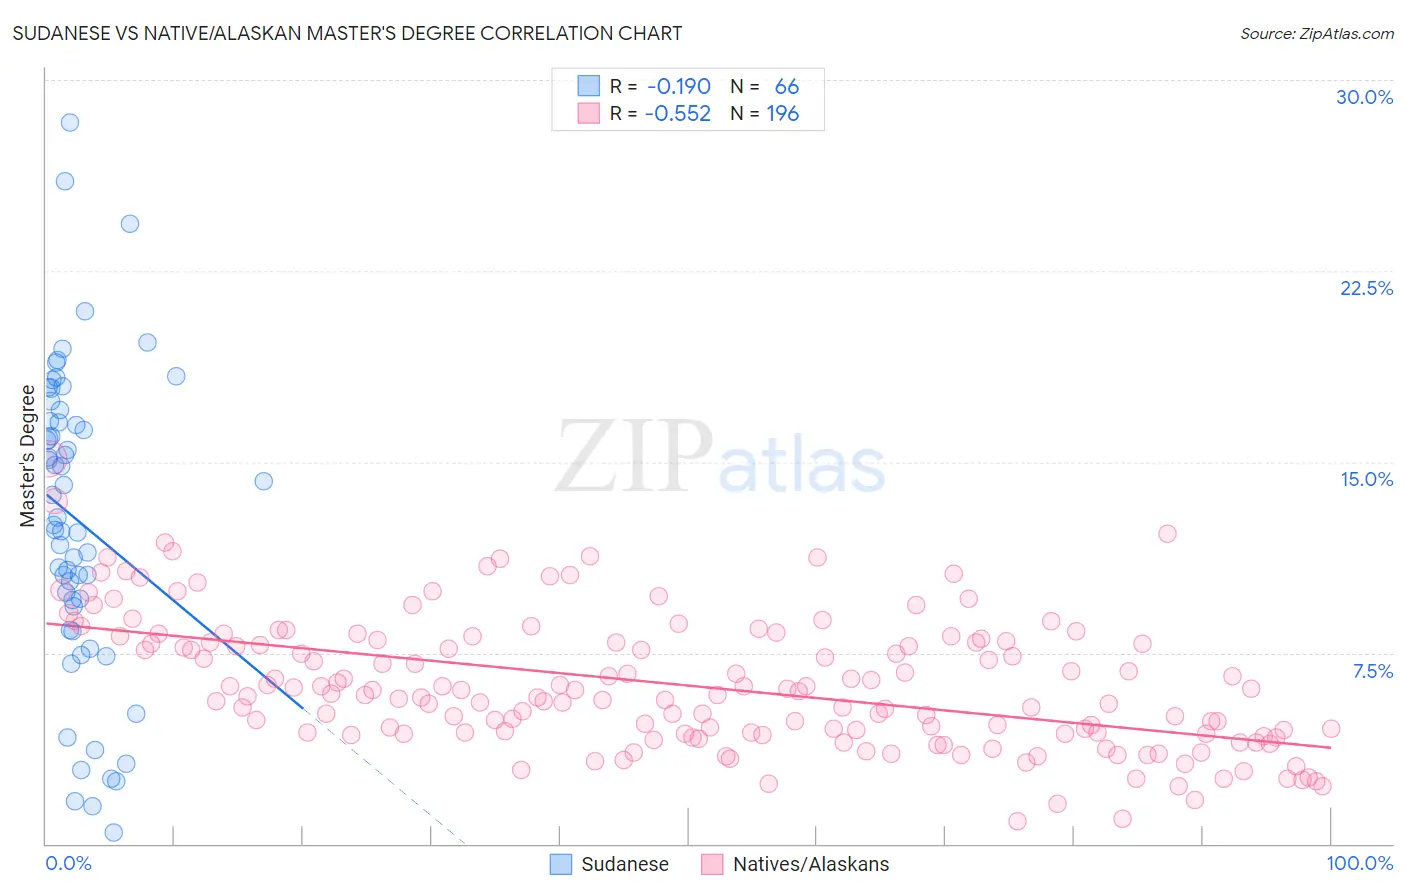
Sudanese vs Native/Alaskan Master's Degree Correlation Chart
The statistical analysis conducted on geographies consisting of 110,110,663 people shows a poor negative correlation between the proportion of Sudanese and percentage of population with at least master's degree education in the United States with a correlation coefficient (R) of -0.190 and weighted average of 15.3%. Similarly, the statistical analysis conducted on geographies consisting of 512,468,242 people shows a substantial negative correlation between the proportion of Natives/Alaskans and percentage of population with at least master's degree education in the United States with a correlation coefficient (R) of -0.552 and weighted average of 9.9%, a difference of 54.0%.
Master's Degree Correlation Summary
| Measurement | Sudanese | Native/Alaskan |
| Minimum | 0.44% | 0.88% |
| Maximum | 28.3% | 15.1% |
| Range | 27.9% | 14.3% |
| Mean | 12.7% | 6.2% |
| Median | 12.7% | 5.9% |
| Interquartile 25% (IQ1) | 9.3% | 4.3% |
| Interquartile 75% (IQ3) | 16.6% | 7.9% |
| Interquartile Range (IQR) | 7.3% | 3.6% |
| Standard Deviation (Sample) | 6.0% | 2.6% |
| Standard Deviation (Population) | 6.0% | 2.6% |
Similar Demographics by Master's Degree
Demographics Similar to Sudanese by Master's Degree
In terms of master's degree, the demographic groups most similar to Sudanese are Peruvian (15.3%, a difference of 0.010%), Kenyan (15.3%, a difference of 0.23%), Uruguayan (15.3%, a difference of 0.23%), Colombian (15.3%, a difference of 0.26%), and Immigrants from Kenya (15.3%, a difference of 0.30%).
| Demographics | Rating | Rank | Master's Degree |
| Immigrants | South America | 76.3 /100 | #154 | Good 15.5% |
| Immigrants | Bangladesh | 76.1 /100 | #155 | Good 15.5% |
| Bermudans | 73.9 /100 | #156 | Good 15.4% |
| Immigrants | Cameroon | 71.7 /100 | #157 | Good 15.4% |
| Immigrants | Poland | 71.5 /100 | #158 | Good 15.4% |
| Luxembourgers | 71.0 /100 | #159 | Good 15.3% |
| Kenyans | 70.3 /100 | #160 | Good 15.3% |
| Sudanese | 68.7 /100 | #161 | Good 15.3% |
| Peruvians | 68.7 /100 | #162 | Good 15.3% |
| Uruguayans | 67.1 /100 | #163 | Good 15.3% |
| Colombians | 66.9 /100 | #164 | Good 15.3% |
| Immigrants | Kenya | 66.6 /100 | #165 | Good 15.3% |
| Swedes | 66.1 /100 | #166 | Good 15.2% |
| Senegalese | 65.6 /100 | #167 | Good 15.2% |
| Immigrants | North Macedonia | 64.5 /100 | #168 | Good 15.2% |
Demographics Similar to Natives/Alaskans by Master's Degree
In terms of master's degree, the demographic groups most similar to Natives/Alaskans are Immigrants from Central America (10.0%, a difference of 0.50%), Arapaho (10.0%, a difference of 0.64%), Mexican (9.7%, a difference of 2.2%), Tohono O'odham (9.7%, a difference of 2.3%), and Menominee (10.2%, a difference of 2.6%).
| Demographics | Rating | Rank | Master's Degree |
| Nepalese | 0.0 /100 | #329 | Tragic 10.5% |
| Fijians | 0.0 /100 | #330 | Tragic 10.3% |
| Pueblo | 0.0 /100 | #331 | Tragic 10.3% |
| Immigrants | Azores | 0.0 /100 | #332 | Tragic 10.2% |
| Menominee | 0.0 /100 | #333 | Tragic 10.2% |
| Arapaho | 0.0 /100 | #334 | Tragic 10.0% |
| Immigrants | Central America | 0.0 /100 | #335 | Tragic 10.0% |
| Natives/Alaskans | 0.0 /100 | #336 | Tragic 9.9% |
| Mexicans | 0.0 /100 | #337 | Tragic 9.7% |
| Tohono O'odham | 0.0 /100 | #338 | Tragic 9.7% |
| Spanish American Indians | 0.0 /100 | #339 | Tragic 9.6% |
| Yakama | 0.0 /100 | #340 | Tragic 9.5% |
| Navajo | 0.0 /100 | #341 | Tragic 9.4% |
| Immigrants | Mexico | 0.0 /100 | #342 | Tragic 9.3% |
| Lumbee | 0.0 /100 | #343 | Tragic 9.3% |