Immigrants from South America vs Laotian Master's Degree
COMPARE
Immigrants from South America
Laotian
Master's Degree
Master's Degree Comparison
Immigrants from South America
Laotians
15.5%
MASTER'S DEGREE
76.3/ 100
METRIC RATING
154th/ 347
METRIC RANK
17.0%
MASTER'S DEGREE
98.8/ 100
METRIC RATING
99th/ 347
METRIC RANK
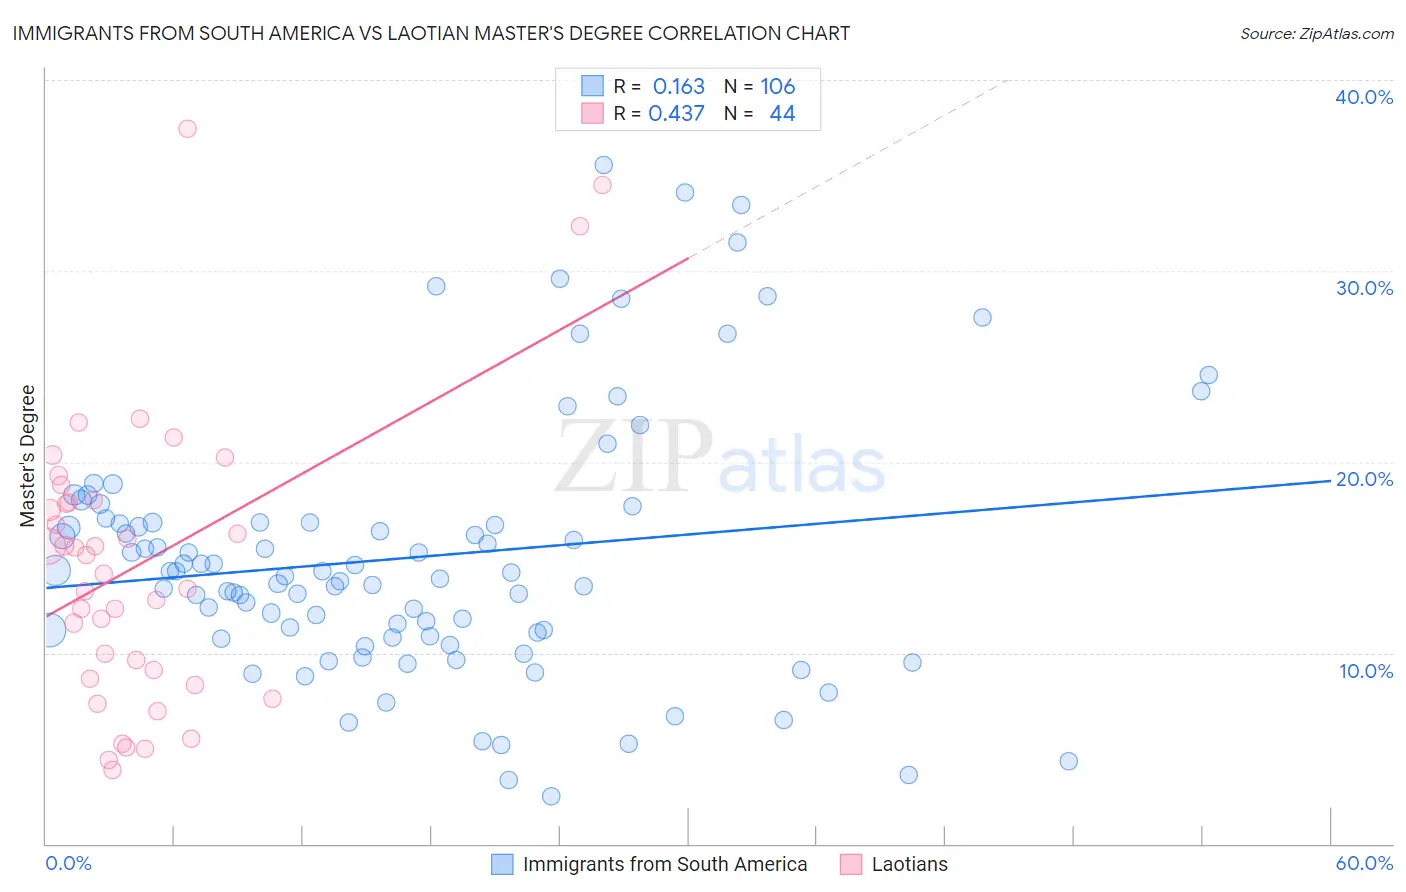
Immigrants from South America vs Laotian Master's Degree Correlation Chart
The statistical analysis conducted on geographies consisting of 486,157,509 people shows a poor positive correlation between the proportion of Immigrants from South America and percentage of population with at least master's degree education in the United States with a correlation coefficient (R) of 0.163 and weighted average of 15.5%. Similarly, the statistical analysis conducted on geographies consisting of 224,808,170 people shows a moderate positive correlation between the proportion of Laotians and percentage of population with at least master's degree education in the United States with a correlation coefficient (R) of 0.437 and weighted average of 17.0%, a difference of 10.0%.
Master's Degree Correlation Summary
| Measurement | Immigrants from South America | Laotian |
| Minimum | 2.5% | 3.9% |
| Maximum | 35.5% | 37.4% |
| Range | 33.0% | 33.6% |
| Mean | 15.0% | 14.6% |
| Median | 14.1% | 14.6% |
| Interquartile 25% (IQ1) | 10.9% | 8.9% |
| Interquartile 75% (IQ3) | 16.8% | 17.9% |
| Interquartile Range (IQR) | 5.9% | 9.1% |
| Standard Deviation (Sample) | 6.8% | 7.6% |
| Standard Deviation (Population) | 6.8% | 7.5% |
Similar Demographics by Master's Degree
Demographics Similar to Immigrants from South America by Master's Degree
In terms of master's degree, the demographic groups most similar to Immigrants from South America are Immigrants from Bangladesh (15.5%, a difference of 0.040%), Icelander (15.5%, a difference of 0.090%), Slavic (15.5%, a difference of 0.12%), Iraqi (15.5%, a difference of 0.17%), and Slovene (15.5%, a difference of 0.29%).
| Demographics | Rating | Rank | Master's Degree |
| Hungarians | 79.1 /100 | #147 | Good 15.6% |
| Immigrants | Senegal | 78.2 /100 | #148 | Good 15.5% |
| Ghanaians | 78.2 /100 | #149 | Good 15.5% |
| Slovenes | 78.0 /100 | #150 | Good 15.5% |
| Iraqis | 77.3 /100 | #151 | Good 15.5% |
| Slavs | 77.0 /100 | #152 | Good 15.5% |
| Icelanders | 76.8 /100 | #153 | Good 15.5% |
| Immigrants | South America | 76.3 /100 | #154 | Good 15.5% |
| Immigrants | Bangladesh | 76.1 /100 | #155 | Good 15.5% |
| Bermudans | 73.9 /100 | #156 | Good 15.4% |
| Immigrants | Cameroon | 71.7 /100 | #157 | Good 15.4% |
| Immigrants | Poland | 71.5 /100 | #158 | Good 15.4% |
| Luxembourgers | 71.0 /100 | #159 | Good 15.3% |
| Kenyans | 70.3 /100 | #160 | Good 15.3% |
| Sudanese | 68.7 /100 | #161 | Good 15.3% |
Demographics Similar to Laotians by Master's Degree
In terms of master's degree, the demographic groups most similar to Laotians are Immigrants from Ukraine (17.0%, a difference of 0.060%), Immigrants from England (17.0%, a difference of 0.15%), Albanian (17.0%, a difference of 0.21%), Immigrants from Northern Africa (17.1%, a difference of 0.32%), and Immigrants from Morocco (17.1%, a difference of 0.35%).
| Demographics | Rating | Rank | Master's Degree |
| Immigrants | North America | 99.1 /100 | #92 | Exceptional 17.2% |
| Immigrants | Italy | 99.1 /100 | #93 | Exceptional 17.2% |
| Ugandans | 99.0 /100 | #94 | Exceptional 17.1% |
| Immigrants | Morocco | 98.9 /100 | #95 | Exceptional 17.1% |
| Immigrants | Northern Africa | 98.9 /100 | #96 | Exceptional 17.1% |
| Immigrants | England | 98.8 /100 | #97 | Exceptional 17.0% |
| Immigrants | Ukraine | 98.8 /100 | #98 | Exceptional 17.0% |
| Laotians | 98.8 /100 | #99 | Exceptional 17.0% |
| Albanians | 98.7 /100 | #100 | Exceptional 17.0% |
| Immigrants | Nepal | 98.6 /100 | #101 | Exceptional 17.0% |
| Chileans | 98.6 /100 | #102 | Exceptional 16.9% |
| Alsatians | 98.4 /100 | #103 | Exceptional 16.9% |
| Ukrainians | 98.3 /100 | #104 | Exceptional 16.9% |
| Syrians | 98.3 /100 | #105 | Exceptional 16.8% |
| Immigrants | Albania | 98.1 /100 | #106 | Exceptional 16.8% |