Sudanese vs Hopi Master's Degree
COMPARE
Sudanese
Hopi
Master's Degree
Master's Degree Comparison
Sudanese
Hopi
15.3%
MASTER'S DEGREE
68.7/ 100
METRIC RATING
161st/ 347
METRIC RANK
10.9%
MASTER'S DEGREE
0.0/ 100
METRIC RATING
317th/ 347
METRIC RANK
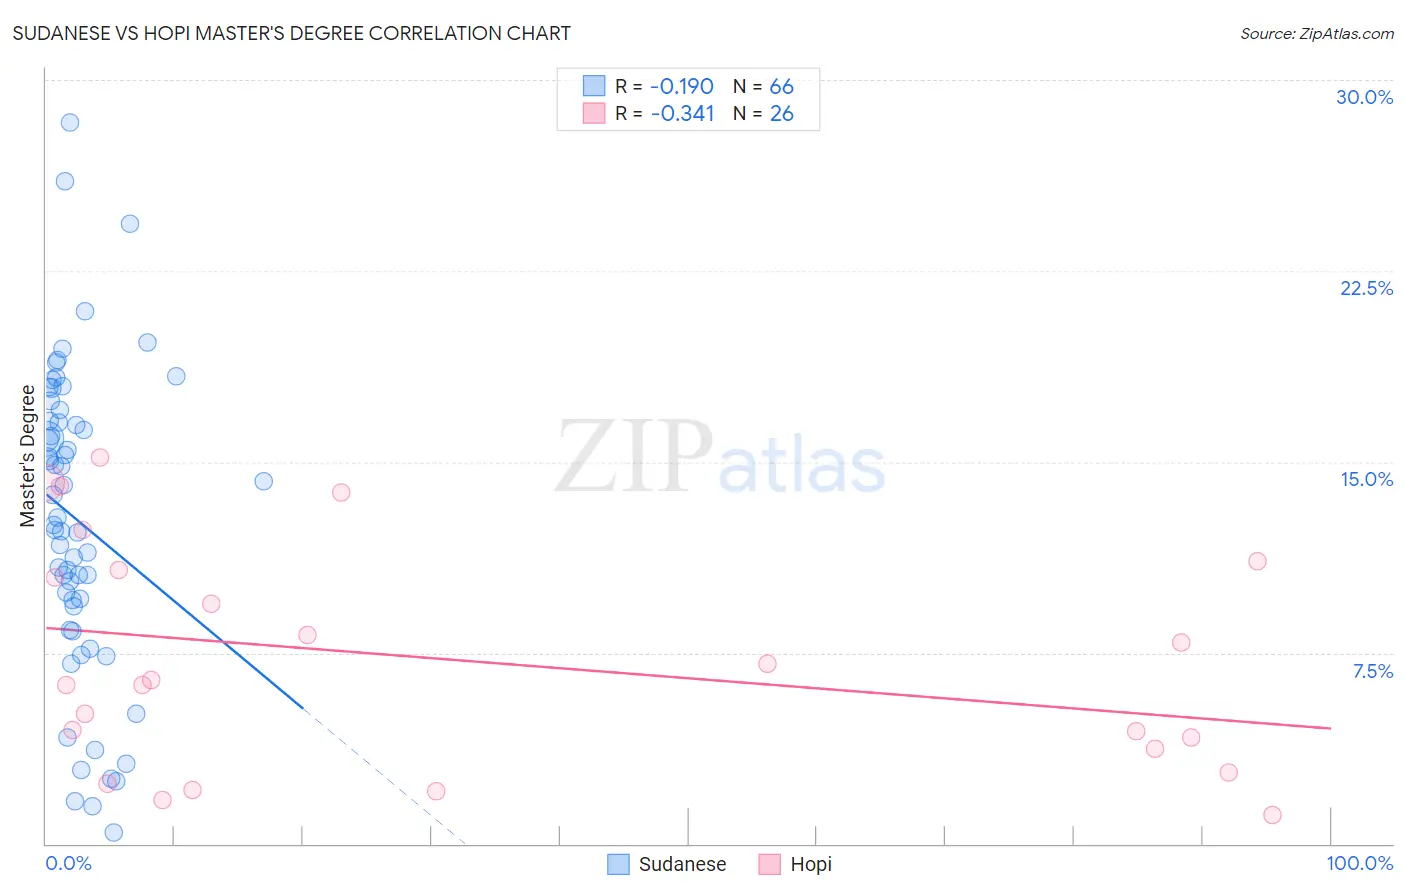
Sudanese vs Hopi Master's Degree Correlation Chart
The statistical analysis conducted on geographies consisting of 110,110,663 people shows a poor negative correlation between the proportion of Sudanese and percentage of population with at least master's degree education in the United States with a correlation coefficient (R) of -0.190 and weighted average of 15.3%. Similarly, the statistical analysis conducted on geographies consisting of 74,729,525 people shows a mild negative correlation between the proportion of Hopi and percentage of population with at least master's degree education in the United States with a correlation coefficient (R) of -0.341 and weighted average of 10.9%, a difference of 40.7%.
Master's Degree Correlation Summary
| Measurement | Sudanese | Hopi |
| Minimum | 0.44% | 1.1% |
| Maximum | 28.3% | 15.2% |
| Range | 27.9% | 14.1% |
| Mean | 12.7% | 7.2% |
| Median | 12.7% | 6.3% |
| Interquartile 25% (IQ1) | 9.3% | 3.7% |
| Interquartile 75% (IQ3) | 16.6% | 10.8% |
| Interquartile Range (IQR) | 7.3% | 7.0% |
| Standard Deviation (Sample) | 6.0% | 4.4% |
| Standard Deviation (Population) | 6.0% | 4.3% |
Similar Demographics by Master's Degree
Demographics Similar to Sudanese by Master's Degree
In terms of master's degree, the demographic groups most similar to Sudanese are Peruvian (15.3%, a difference of 0.010%), Kenyan (15.3%, a difference of 0.23%), Uruguayan (15.3%, a difference of 0.23%), Colombian (15.3%, a difference of 0.26%), and Immigrants from Kenya (15.3%, a difference of 0.30%).
| Demographics | Rating | Rank | Master's Degree |
| Immigrants | South America | 76.3 /100 | #154 | Good 15.5% |
| Immigrants | Bangladesh | 76.1 /100 | #155 | Good 15.5% |
| Bermudans | 73.9 /100 | #156 | Good 15.4% |
| Immigrants | Cameroon | 71.7 /100 | #157 | Good 15.4% |
| Immigrants | Poland | 71.5 /100 | #158 | Good 15.4% |
| Luxembourgers | 71.0 /100 | #159 | Good 15.3% |
| Kenyans | 70.3 /100 | #160 | Good 15.3% |
| Sudanese | 68.7 /100 | #161 | Good 15.3% |
| Peruvians | 68.7 /100 | #162 | Good 15.3% |
| Uruguayans | 67.1 /100 | #163 | Good 15.3% |
| Colombians | 66.9 /100 | #164 | Good 15.3% |
| Immigrants | Kenya | 66.6 /100 | #165 | Good 15.3% |
| Swedes | 66.1 /100 | #166 | Good 15.2% |
| Senegalese | 65.6 /100 | #167 | Good 15.2% |
| Immigrants | North Macedonia | 64.5 /100 | #168 | Good 15.2% |
Demographics Similar to Hopi by Master's Degree
In terms of master's degree, the demographic groups most similar to Hopi are Immigrants from Cuba (10.9%, a difference of 0.13%), Kiowa (10.8%, a difference of 0.37%), Hispanic or Latino (10.9%, a difference of 0.54%), Cajun (11.0%, a difference of 0.88%), and Apache (11.0%, a difference of 0.88%).
| Demographics | Rating | Rank | Master's Degree |
| Shoshone | 0.0 /100 | #310 | Tragic 11.1% |
| Seminole | 0.0 /100 | #311 | Tragic 11.0% |
| Choctaw | 0.0 /100 | #312 | Tragic 11.0% |
| Yaqui | 0.0 /100 | #313 | Tragic 11.0% |
| Cajuns | 0.0 /100 | #314 | Tragic 11.0% |
| Apache | 0.0 /100 | #315 | Tragic 11.0% |
| Hispanics or Latinos | 0.0 /100 | #316 | Tragic 10.9% |
| Hopi | 0.0 /100 | #317 | Tragic 10.9% |
| Immigrants | Cuba | 0.0 /100 | #318 | Tragic 10.9% |
| Kiowa | 0.0 /100 | #319 | Tragic 10.8% |
| Immigrants | Micronesia | 0.0 /100 | #320 | Tragic 10.8% |
| Pennsylvania Germans | 0.0 /100 | #321 | Tragic 10.7% |
| Sioux | 0.0 /100 | #322 | Tragic 10.7% |
| Crow | 0.0 /100 | #323 | Tragic 10.6% |
| Dutch West Indians | 0.0 /100 | #324 | Tragic 10.6% |