Subsaharan African vs Immigrants from Israel Disability Age Under 5
COMPARE
Subsaharan African
Immigrants from Israel
Disability Age Under 5
Disability Age Under 5 Comparison
Sub-Saharan Africans
Immigrants from Israel
1.3%
DISABILITY AGE UNDER 5
8.3/ 100
METRIC RATING
221st/ 347
METRIC RANK
0.96%
DISABILITY AGE UNDER 5
100.0/ 100
METRIC RATING
16th/ 347
METRIC RANK
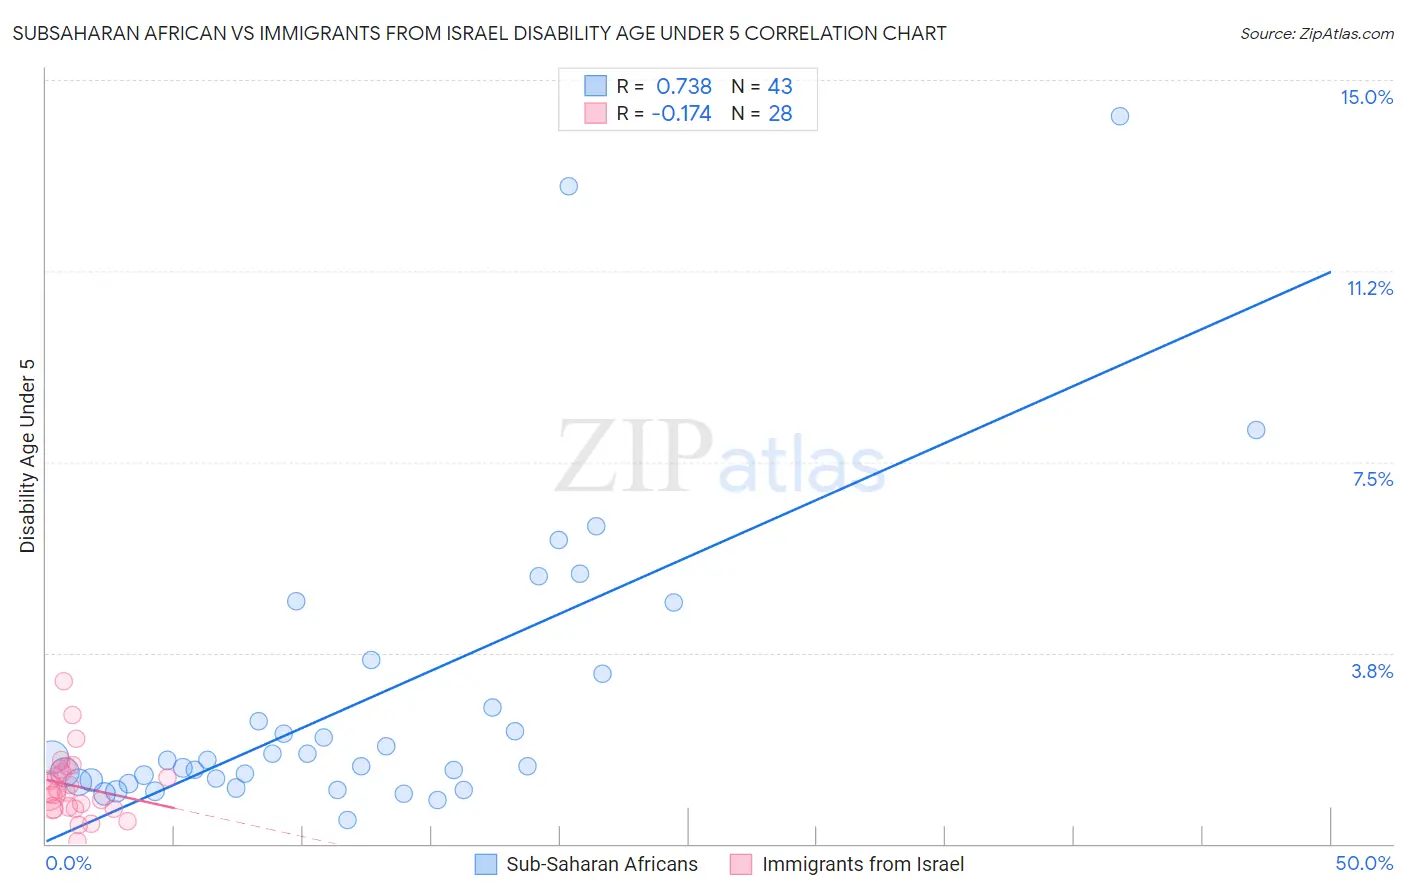
Subsaharan African vs Immigrants from Israel Disability Age Under 5 Correlation Chart
The statistical analysis conducted on geographies consisting of 252,320,472 people shows a strong positive correlation between the proportion of Sub-Saharan Africans and percentage of population with a disability under the age of 5 in the United States with a correlation coefficient (R) of 0.738 and weighted average of 1.3%. Similarly, the statistical analysis conducted on geographies consisting of 133,347,398 people shows a poor negative correlation between the proportion of Immigrants from Israel and percentage of population with a disability under the age of 5 in the United States with a correlation coefficient (R) of -0.174 and weighted average of 0.96%, a difference of 36.3%.
Disability Age Under 5 Correlation Summary
| Measurement | Subsaharan African | Immigrants from Israel |
| Minimum | 0.47% | 0.058% |
| Maximum | 14.3% | 3.2% |
| Range | 13.8% | 3.1% |
| Mean | 2.8% | 1.1% |
| Median | 1.6% | 1.0% |
| Interquartile 25% (IQ1) | 1.2% | 0.70% |
| Interquartile 75% (IQ3) | 3.4% | 1.4% |
| Interquartile Range (IQR) | 2.1% | 0.74% |
| Standard Deviation (Sample) | 3.0% | 0.66% |
| Standard Deviation (Population) | 2.9% | 0.65% |
Similar Demographics by Disability Age Under 5
Demographics Similar to Sub-Saharan Africans by Disability Age Under 5
In terms of disability age under 5, the demographic groups most similar to Sub-Saharan Africans are Ukrainian (1.3%, a difference of 0.0%), Hispanic or Latino (1.3%, a difference of 0.19%), Serbian (1.3%, a difference of 0.34%), Latvian (1.3%, a difference of 0.35%), and Panamanian (1.3%, a difference of 0.38%).
| Demographics | Rating | Rank | Disability Age Under 5 |
| Immigrants | Chile | 17.2 /100 | #214 | Poor 1.3% |
| Syrians | 16.1 /100 | #215 | Poor 1.3% |
| Bangladeshis | 15.5 /100 | #216 | Poor 1.3% |
| Cypriots | 14.9 /100 | #217 | Poor 1.3% |
| Malaysians | 13.2 /100 | #218 | Poor 1.3% |
| Immigrants | Croatia | 11.2 /100 | #219 | Poor 1.3% |
| Serbians | 9.6 /100 | #220 | Tragic 1.3% |
| Sub-Saharan Africans | 8.3 /100 | #221 | Tragic 1.3% |
| Ukrainians | 8.3 /100 | #222 | Tragic 1.3% |
| Hispanics or Latinos | 7.7 /100 | #223 | Tragic 1.3% |
| Latvians | 7.1 /100 | #224 | Tragic 1.3% |
| Panamanians | 7.1 /100 | #225 | Tragic 1.3% |
| Bahamians | 7.1 /100 | #226 | Tragic 1.3% |
| Taiwanese | 6.1 /100 | #227 | Tragic 1.3% |
| Luxembourgers | 6.1 /100 | #228 | Tragic 1.3% |
Demographics Similar to Immigrants from Israel by Disability Age Under 5
In terms of disability age under 5, the demographic groups most similar to Immigrants from Israel are Immigrants from China (0.96%, a difference of 0.41%), Immigrants from Barbados (0.97%, a difference of 1.0%), Immigrants from Hong Kong (0.95%, a difference of 1.3%), Yuman (0.95%, a difference of 1.3%), and Puget Sound Salish (0.97%, a difference of 1.4%).
| Demographics | Rating | Rank | Disability Age Under 5 |
| Immigrants | Fiji | 100.0 /100 | #9 | Exceptional 0.92% |
| Marshallese | 100.0 /100 | #10 | Exceptional 0.94% |
| Afghans | 100.0 /100 | #11 | Exceptional 0.94% |
| Immigrants | Grenada | 100.0 /100 | #12 | Exceptional 0.94% |
| Soviet Union | 100.0 /100 | #13 | Exceptional 0.95% |
| Yuman | 100.0 /100 | #14 | Exceptional 0.95% |
| Immigrants | Hong Kong | 100.0 /100 | #15 | Exceptional 0.95% |
| Immigrants | Israel | 100.0 /100 | #16 | Exceptional 0.96% |
| Immigrants | China | 100.0 /100 | #17 | Exceptional 0.96% |
| Immigrants | Barbados | 100.0 /100 | #18 | Exceptional 0.97% |
| Puget Sound Salish | 100.0 /100 | #19 | Exceptional 0.97% |
| Nepalese | 100.0 /100 | #20 | Exceptional 0.97% |
| British West Indians | 100.0 /100 | #21 | Exceptional 0.99% |
| Immigrants | Iran | 100.0 /100 | #22 | Exceptional 1.00% |
| Yakama | 100.0 /100 | #23 | Exceptional 1.00% |