Immigrants from Croatia vs Immigrants from Israel No Schooling Completed
COMPARE
Immigrants from Croatia
Immigrants from Israel
No Schooling Completed
No Schooling Completed Comparison
Immigrants from Croatia
Immigrants from Israel
1.9%
NO SCHOOLING COMPLETED
94.5/ 100
METRIC RATING
121st/ 347
METRIC RANK
2.0%
NO SCHOOLING COMPLETED
85.4/ 100
METRIC RATING
138th/ 347
METRIC RANK
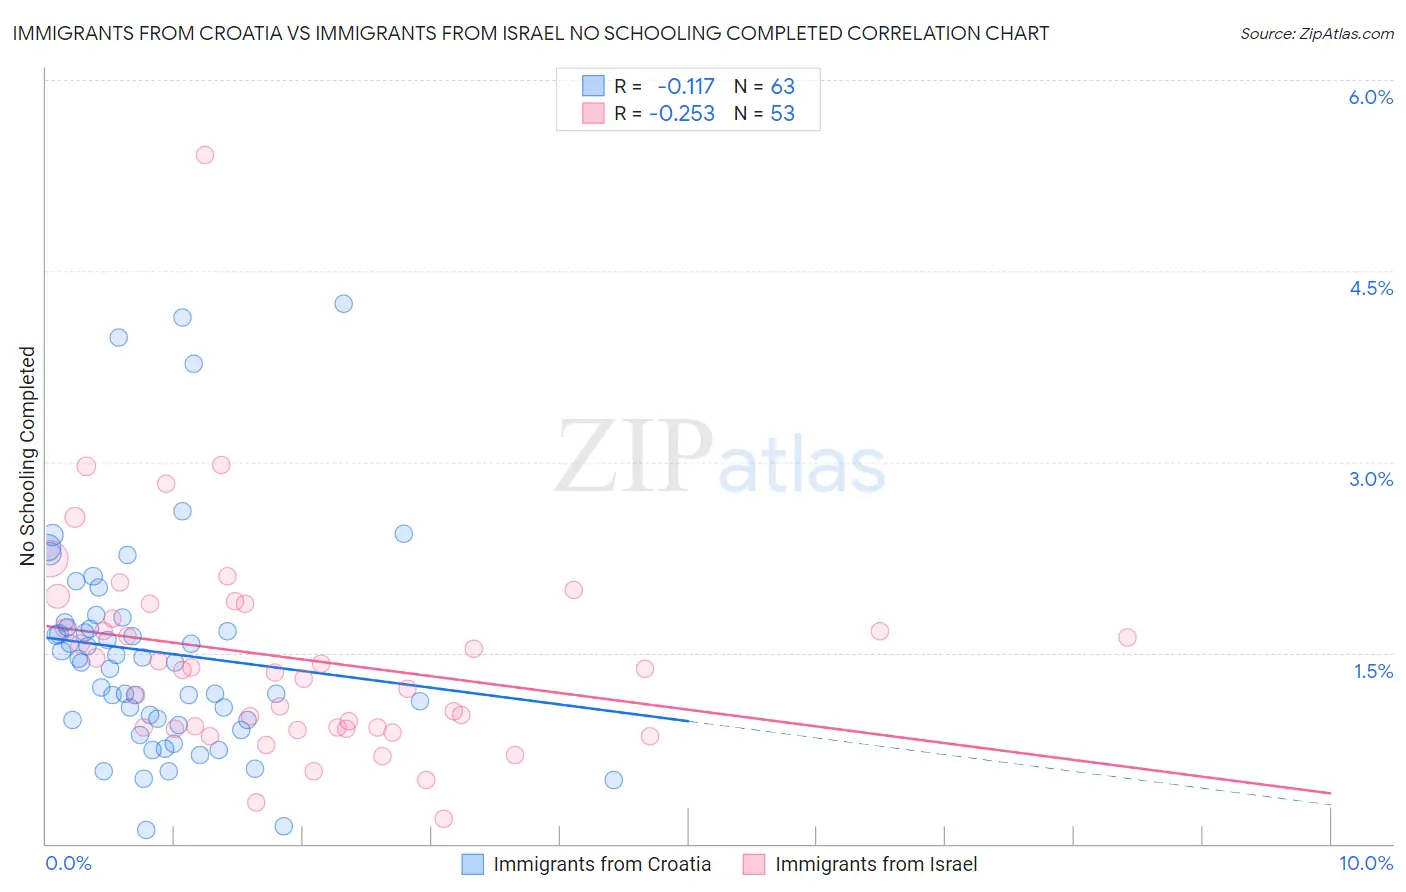
Immigrants from Croatia vs Immigrants from Israel No Schooling Completed Correlation Chart
The statistical analysis conducted on geographies consisting of 132,073,413 people shows a poor negative correlation between the proportion of Immigrants from Croatia and percentage of population with no schooling in the United States with a correlation coefficient (R) of -0.117 and weighted average of 1.9%. Similarly, the statistical analysis conducted on geographies consisting of 208,773,041 people shows a weak negative correlation between the proportion of Immigrants from Israel and percentage of population with no schooling in the United States with a correlation coefficient (R) of -0.253 and weighted average of 2.0%, a difference of 4.0%.
No Schooling Completed Correlation Summary
| Measurement | Immigrants from Croatia | Immigrants from Israel |
| Minimum | 0.11% | 0.20% |
| Maximum | 4.2% | 5.4% |
| Range | 4.1% | 5.2% |
| Mean | 1.5% | 1.5% |
| Median | 1.4% | 1.4% |
| Interquartile 25% (IQ1) | 0.97% | 0.91% |
| Interquartile 75% (IQ3) | 1.7% | 1.8% |
| Interquartile Range (IQR) | 0.77% | 0.92% |
| Standard Deviation (Sample) | 0.87% | 0.84% |
| Standard Deviation (Population) | 0.86% | 0.83% |
Demographics Similar to Immigrants from Croatia and Immigrants from Israel by No Schooling Completed
In terms of no schooling completed, the demographic groups most similar to Immigrants from Croatia are Cree (1.9%, a difference of 0.030%), Immigrants from Bulgaria (1.9%, a difference of 0.060%), Immigrants from Kuwait (1.9%, a difference of 0.39%), Iroquois (1.9%, a difference of 0.47%), and Cambodian (1.9%, a difference of 0.47%). Similarly, the demographic groups most similar to Immigrants from Israel are Filipino (2.0%, a difference of 0.030%), Jordanian (2.0%, a difference of 0.25%), Burmese (1.9%, a difference of 0.89%), Hmong (1.9%, a difference of 0.98%), and Menominee (1.9%, a difference of 1.4%).
| Demographics | Rating | Rank | No Schooling Completed |
| Iroquois | 95.1 /100 | #119 | Exceptional 1.9% |
| Immigrants | Bulgaria | 94.6 /100 | #120 | Exceptional 1.9% |
| Immigrants | Croatia | 94.5 /100 | #121 | Exceptional 1.9% |
| Cree | 94.5 /100 | #122 | Exceptional 1.9% |
| Immigrants | Kuwait | 93.9 /100 | #123 | Exceptional 1.9% |
| Cambodians | 93.8 /100 | #124 | Exceptional 1.9% |
| Immigrants | Europe | 93.7 /100 | #125 | Exceptional 1.9% |
| Immigrants | Romania | 92.6 /100 | #126 | Exceptional 1.9% |
| Israelis | 92.4 /100 | #127 | Exceptional 1.9% |
| Spaniards | 92.3 /100 | #128 | Exceptional 1.9% |
| Seminole | 92.0 /100 | #129 | Exceptional 1.9% |
| Palestinians | 91.8 /100 | #130 | Exceptional 1.9% |
| Immigrants | Hungary | 91.6 /100 | #131 | Exceptional 1.9% |
| Colville | 90.4 /100 | #132 | Exceptional 1.9% |
| Immigrants | Turkey | 90.2 /100 | #133 | Exceptional 1.9% |
| Menominee | 89.6 /100 | #134 | Excellent 1.9% |
| Hmong | 88.5 /100 | #135 | Excellent 1.9% |
| Burmese | 88.2 /100 | #136 | Excellent 1.9% |
| Filipinos | 85.5 /100 | #137 | Excellent 2.0% |
| Immigrants | Israel | 85.4 /100 | #138 | Excellent 2.0% |
| Jordanians | 84.5 /100 | #139 | Excellent 2.0% |