Dominican vs Chilean 10th Grade
COMPARE
Dominican
Chilean
10th Grade
10th Grade Comparison
Dominicans
Chileans
89.4%
10TH GRADE
0.0/ 100
METRIC RATING
329th/ 347
METRIC RANK
93.9%
10TH GRADE
70.2/ 100
METRIC RATING
159th/ 347
METRIC RANK
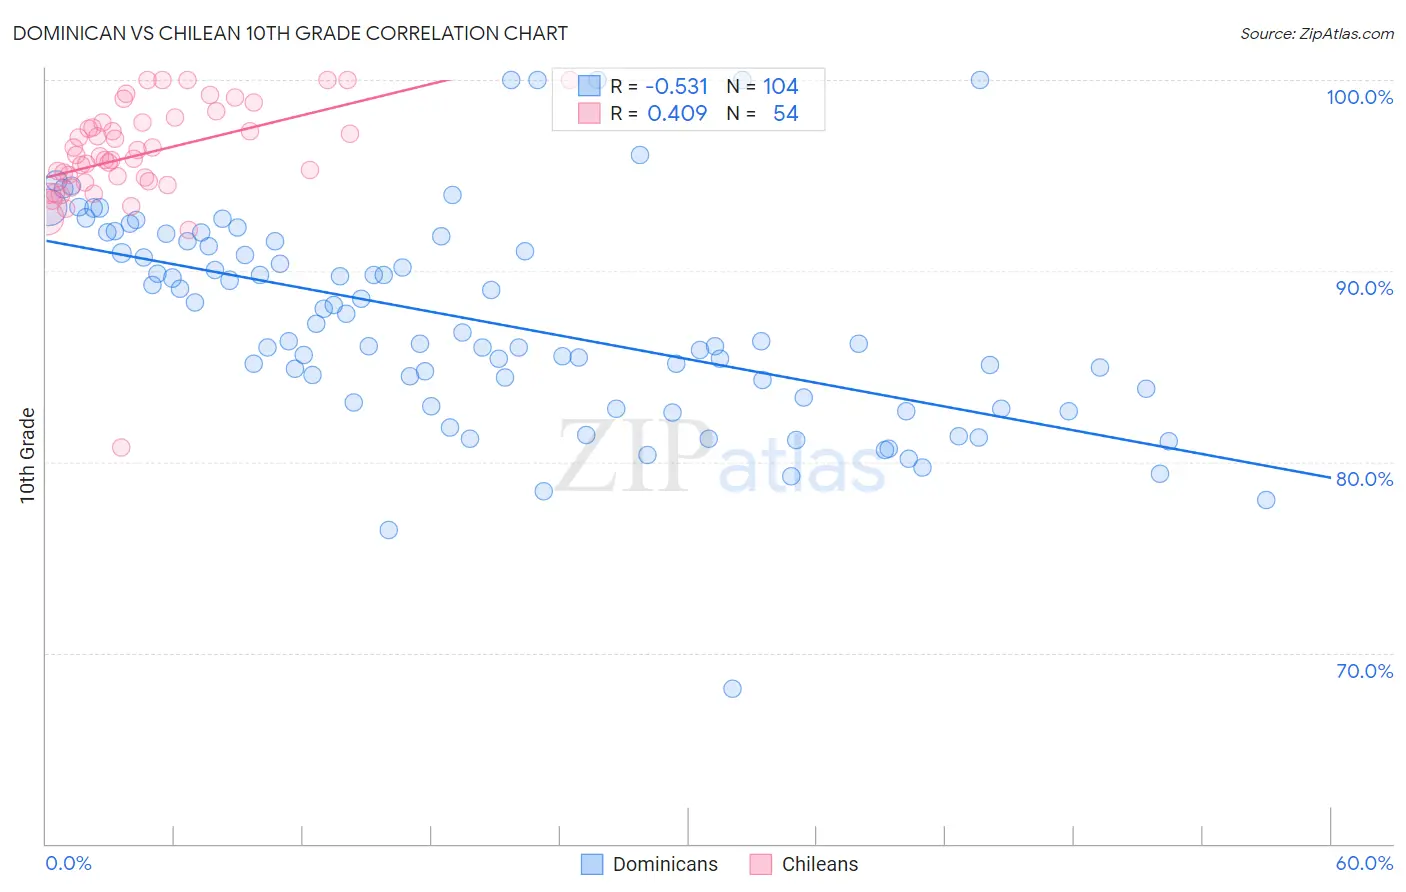
Dominican vs Chilean 10th Grade Correlation Chart
The statistical analysis conducted on geographies consisting of 355,142,452 people shows a substantial negative correlation between the proportion of Dominicans and percentage of population with at least 10th grade education in the United States with a correlation coefficient (R) of -0.531 and weighted average of 89.4%. Similarly, the statistical analysis conducted on geographies consisting of 256,683,580 people shows a moderate positive correlation between the proportion of Chileans and percentage of population with at least 10th grade education in the United States with a correlation coefficient (R) of 0.409 and weighted average of 93.9%, a difference of 5.1%.
10th Grade Correlation Summary
| Measurement | Dominican | Chilean |
| Minimum | 68.1% | 80.8% |
| Maximum | 100.0% | 100.0% |
| Range | 31.9% | 19.2% |
| Mean | 87.3% | 96.1% |
| Median | 86.3% | 96.0% |
| Interquartile 25% (IQ1) | 83.2% | 94.7% |
| Interquartile 75% (IQ3) | 91.4% | 97.8% |
| Interquartile Range (IQR) | 8.2% | 3.0% |
| Standard Deviation (Sample) | 5.6% | 3.0% |
| Standard Deviation (Population) | 5.6% | 3.0% |
Similar Demographics by 10th Grade
Demographics Similar to Dominicans by 10th Grade
In terms of 10th grade, the demographic groups most similar to Dominicans are Immigrants from Cabo Verde (89.5%, a difference of 0.10%), Immigrants from Nicaragua (89.5%, a difference of 0.11%), Immigrants from Yemen (89.1%, a difference of 0.35%), Central American Indian (89.7%, a difference of 0.37%), and Mexican American Indian (89.0%, a difference of 0.38%).
| Demographics | Rating | Rank | 10th Grade |
| Tohono O'odham | 0.0 /100 | #322 | Tragic 90.1% |
| Immigrants | Belize | 0.0 /100 | #323 | Tragic 90.1% |
| Immigrants | Armenia | 0.0 /100 | #324 | Tragic 89.9% |
| Puerto Ricans | 0.0 /100 | #325 | Tragic 89.8% |
| Central American Indians | 0.0 /100 | #326 | Tragic 89.7% |
| Immigrants | Nicaragua | 0.0 /100 | #327 | Tragic 89.5% |
| Immigrants | Cabo Verde | 0.0 /100 | #328 | Tragic 89.5% |
| Dominicans | 0.0 /100 | #329 | Tragic 89.4% |
| Immigrants | Yemen | 0.0 /100 | #330 | Tragic 89.1% |
| Mexican American Indians | 0.0 /100 | #331 | Tragic 89.0% |
| Immigrants | Azores | 0.0 /100 | #332 | Tragic 89.0% |
| Hondurans | 0.0 /100 | #333 | Tragic 89.0% |
| Hispanics or Latinos | 0.0 /100 | #334 | Tragic 88.9% |
| Immigrants | Dominican Republic | 0.0 /100 | #335 | Tragic 88.7% |
| Immigrants | Honduras | 0.0 /100 | #336 | Tragic 88.5% |
Demographics Similar to Chileans by 10th Grade
In terms of 10th grade, the demographic groups most similar to Chileans are Pakistani (93.9%, a difference of 0.0%), Bermudan (93.9%, a difference of 0.010%), Assyrian/Chaldean/Syriac (93.9%, a difference of 0.010%), Immigrants from Poland (93.9%, a difference of 0.010%), and Venezuelan (93.9%, a difference of 0.010%).
| Demographics | Rating | Rank | 10th Grade |
| Immigrants | Italy | 78.0 /100 | #152 | Good 94.0% |
| Immigrants | Brazil | 75.5 /100 | #153 | Good 94.0% |
| Immigrants | Kenya | 75.3 /100 | #154 | Good 94.0% |
| Spanish | 74.9 /100 | #155 | Good 94.0% |
| Mongolians | 74.4 /100 | #156 | Good 94.0% |
| Kiowa | 73.3 /100 | #157 | Good 93.9% |
| Bermudans | 71.0 /100 | #158 | Good 93.9% |
| Chileans | 70.2 /100 | #159 | Good 93.9% |
| Pakistanis | 70.1 /100 | #160 | Good 93.9% |
| Assyrians/Chaldeans/Syriacs | 69.7 /100 | #161 | Good 93.9% |
| Immigrants | Poland | 69.6 /100 | #162 | Good 93.9% |
| Venezuelans | 69.5 /100 | #163 | Good 93.9% |
| Iraqis | 68.1 /100 | #164 | Good 93.9% |
| Brazilians | 63.6 /100 | #165 | Good 93.8% |
| Immigrants | Iraq | 63.0 /100 | #166 | Good 93.8% |