Immigrants from North America vs Chilean 10th Grade
COMPARE
Immigrants from North America
Chilean
10th Grade
10th Grade Comparison
Immigrants from North America
Chileans
95.0%
10TH GRADE
99.8/ 100
METRIC RATING
53rd/ 347
METRIC RANK
93.9%
10TH GRADE
70.2/ 100
METRIC RATING
159th/ 347
METRIC RANK
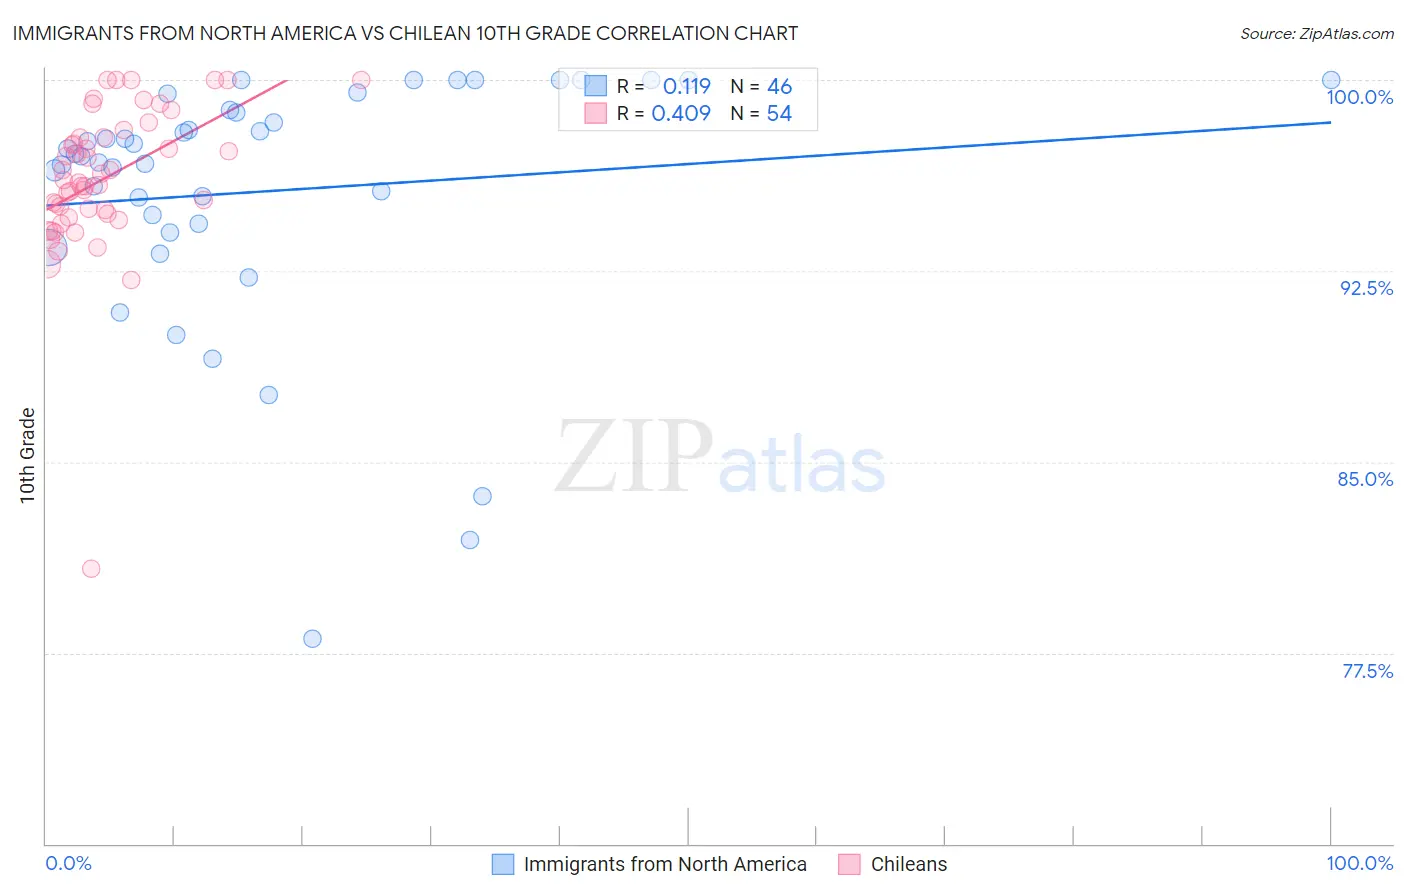
Immigrants from North America vs Chilean 10th Grade Correlation Chart
The statistical analysis conducted on geographies consisting of 462,462,229 people shows a poor positive correlation between the proportion of Immigrants from North America and percentage of population with at least 10th grade education in the United States with a correlation coefficient (R) of 0.119 and weighted average of 95.0%. Similarly, the statistical analysis conducted on geographies consisting of 256,683,580 people shows a moderate positive correlation between the proportion of Chileans and percentage of population with at least 10th grade education in the United States with a correlation coefficient (R) of 0.409 and weighted average of 93.9%, a difference of 1.2%.
10th Grade Correlation Summary
| Measurement | Immigrants from North America | Chilean |
| Minimum | 78.1% | 80.8% |
| Maximum | 100.0% | 100.0% |
| Range | 21.9% | 19.2% |
| Mean | 95.6% | 96.1% |
| Median | 97.0% | 96.0% |
| Interquartile 25% (IQ1) | 94.4% | 94.7% |
| Interquartile 75% (IQ3) | 98.8% | 97.8% |
| Interquartile Range (IQR) | 4.5% | 3.0% |
| Standard Deviation (Sample) | 4.9% | 3.0% |
| Standard Deviation (Population) | 4.9% | 3.0% |
Similar Demographics by 10th Grade
Demographics Similar to Immigrants from North America by 10th Grade
In terms of 10th grade, the demographic groups most similar to Immigrants from North America are Austrian (95.1%, a difference of 0.010%), Ottawa (95.1%, a difference of 0.010%), Immigrants from Canada (95.1%, a difference of 0.020%), Immigrants from Lithuania (95.0%, a difference of 0.020%), and Immigrants from Ireland (95.0%, a difference of 0.030%).
| Demographics | Rating | Rank | 10th Grade |
| Czechoslovakians | 99.9 /100 | #46 | Exceptional 95.1% |
| Serbians | 99.9 /100 | #47 | Exceptional 95.1% |
| Australians | 99.9 /100 | #48 | Exceptional 95.1% |
| Immigrants | Austria | 99.9 /100 | #49 | Exceptional 95.1% |
| Immigrants | Canada | 99.8 /100 | #50 | Exceptional 95.1% |
| Austrians | 99.8 /100 | #51 | Exceptional 95.1% |
| Ottawa | 99.8 /100 | #52 | Exceptional 95.1% |
| Immigrants | North America | 99.8 /100 | #53 | Exceptional 95.0% |
| Immigrants | Lithuania | 99.8 /100 | #54 | Exceptional 95.0% |
| Immigrants | Ireland | 99.8 /100 | #55 | Exceptional 95.0% |
| New Zealanders | 99.8 /100 | #56 | Exceptional 95.0% |
| Ukrainians | 99.8 /100 | #57 | Exceptional 95.0% |
| Aleuts | 99.8 /100 | #58 | Exceptional 95.0% |
| Celtics | 99.8 /100 | #59 | Exceptional 95.0% |
| Cypriots | 99.8 /100 | #60 | Exceptional 95.0% |
Demographics Similar to Chileans by 10th Grade
In terms of 10th grade, the demographic groups most similar to Chileans are Pakistani (93.9%, a difference of 0.0%), Bermudan (93.9%, a difference of 0.010%), Assyrian/Chaldean/Syriac (93.9%, a difference of 0.010%), Immigrants from Poland (93.9%, a difference of 0.010%), and Venezuelan (93.9%, a difference of 0.010%).
| Demographics | Rating | Rank | 10th Grade |
| Immigrants | Italy | 78.0 /100 | #152 | Good 94.0% |
| Immigrants | Brazil | 75.5 /100 | #153 | Good 94.0% |
| Immigrants | Kenya | 75.3 /100 | #154 | Good 94.0% |
| Spanish | 74.9 /100 | #155 | Good 94.0% |
| Mongolians | 74.4 /100 | #156 | Good 94.0% |
| Kiowa | 73.3 /100 | #157 | Good 93.9% |
| Bermudans | 71.0 /100 | #158 | Good 93.9% |
| Chileans | 70.2 /100 | #159 | Good 93.9% |
| Pakistanis | 70.1 /100 | #160 | Good 93.9% |
| Assyrians/Chaldeans/Syriacs | 69.7 /100 | #161 | Good 93.9% |
| Immigrants | Poland | 69.6 /100 | #162 | Good 93.9% |
| Venezuelans | 69.5 /100 | #163 | Good 93.9% |
| Iraqis | 68.1 /100 | #164 | Good 93.9% |
| Brazilians | 63.6 /100 | #165 | Good 93.8% |
| Immigrants | Iraq | 63.0 /100 | #166 | Good 93.8% |