Lithuanian vs Chilean 10th Grade
COMPARE
Lithuanian
Chilean
10th Grade
10th Grade Comparison
Lithuanians
Chileans
95.8%
10TH GRADE
100.0/ 100
METRIC RATING
8th/ 347
METRIC RANK
93.9%
10TH GRADE
70.2/ 100
METRIC RATING
159th/ 347
METRIC RANK
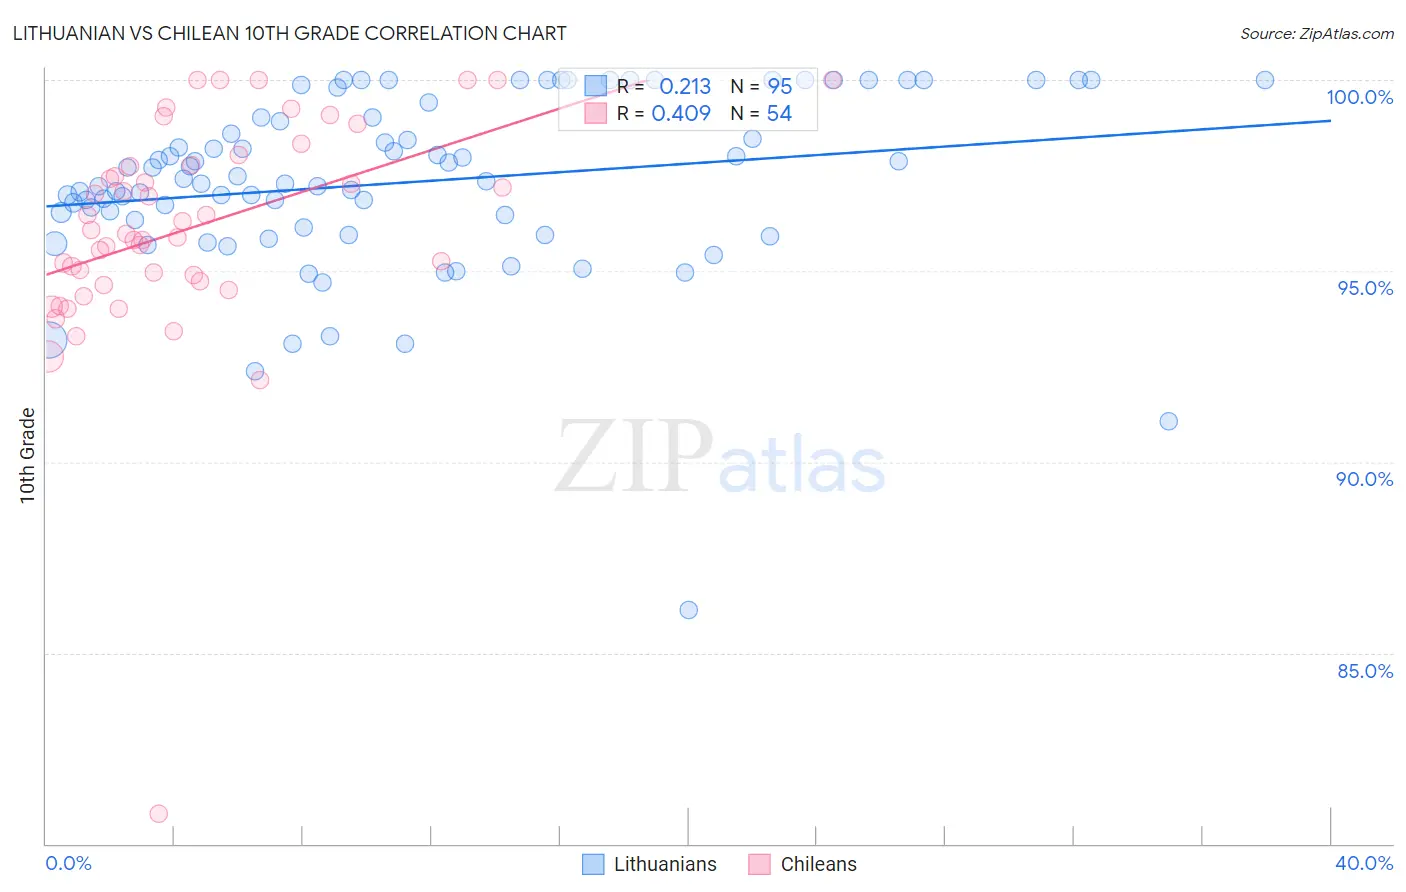
Lithuanian vs Chilean 10th Grade Correlation Chart
The statistical analysis conducted on geographies consisting of 421,947,524 people shows a weak positive correlation between the proportion of Lithuanians and percentage of population with at least 10th grade education in the United States with a correlation coefficient (R) of 0.213 and weighted average of 95.8%. Similarly, the statistical analysis conducted on geographies consisting of 256,683,580 people shows a moderate positive correlation between the proportion of Chileans and percentage of population with at least 10th grade education in the United States with a correlation coefficient (R) of 0.409 and weighted average of 93.9%, a difference of 2.0%.
10th Grade Correlation Summary
| Measurement | Lithuanian | Chilean |
| Minimum | 86.1% | 80.8% |
| Maximum | 100.0% | 100.0% |
| Range | 13.9% | 19.2% |
| Mean | 97.3% | 96.1% |
| Median | 97.4% | 96.0% |
| Interquartile 25% (IQ1) | 96.1% | 94.7% |
| Interquartile 75% (IQ3) | 99.0% | 97.8% |
| Interquartile Range (IQR) | 2.9% | 3.0% |
| Standard Deviation (Sample) | 2.3% | 3.0% |
| Standard Deviation (Population) | 2.3% | 3.0% |
Similar Demographics by 10th Grade
Demographics Similar to Lithuanians by 10th Grade
In terms of 10th grade, the demographic groups most similar to Lithuanians are German (95.8%, a difference of 0.010%), Polish (95.8%, a difference of 0.030%), Finnish (95.8%, a difference of 0.060%), Croatian (95.7%, a difference of 0.080%), and Danish (95.7%, a difference of 0.11%).
| Demographics | Rating | Rank | 10th Grade |
| Norwegians | 100.0 /100 | #1 | Exceptional 96.2% |
| Slovaks | 100.0 /100 | #2 | Exceptional 96.0% |
| Slovenes | 100.0 /100 | #3 | Exceptional 95.9% |
| Swedes | 100.0 /100 | #4 | Exceptional 95.9% |
| Carpatho Rusyns | 100.0 /100 | #5 | Exceptional 95.9% |
| Poles | 100.0 /100 | #6 | Exceptional 95.8% |
| Germans | 100.0 /100 | #7 | Exceptional 95.8% |
| Lithuanians | 100.0 /100 | #8 | Exceptional 95.8% |
| Finns | 100.0 /100 | #9 | Exceptional 95.8% |
| Croatians | 100.0 /100 | #10 | Exceptional 95.7% |
| Danes | 100.0 /100 | #11 | Exceptional 95.7% |
| Tlingit-Haida | 100.0 /100 | #12 | Exceptional 95.7% |
| English | 100.0 /100 | #13 | Exceptional 95.6% |
| Tsimshian | 100.0 /100 | #14 | Exceptional 95.6% |
| Irish | 100.0 /100 | #15 | Exceptional 95.6% |
Demographics Similar to Chileans by 10th Grade
In terms of 10th grade, the demographic groups most similar to Chileans are Pakistani (93.9%, a difference of 0.0%), Bermudan (93.9%, a difference of 0.010%), Assyrian/Chaldean/Syriac (93.9%, a difference of 0.010%), Immigrants from Poland (93.9%, a difference of 0.010%), and Venezuelan (93.9%, a difference of 0.010%).
| Demographics | Rating | Rank | 10th Grade |
| Immigrants | Italy | 78.0 /100 | #152 | Good 94.0% |
| Immigrants | Brazil | 75.5 /100 | #153 | Good 94.0% |
| Immigrants | Kenya | 75.3 /100 | #154 | Good 94.0% |
| Spanish | 74.9 /100 | #155 | Good 94.0% |
| Mongolians | 74.4 /100 | #156 | Good 94.0% |
| Kiowa | 73.3 /100 | #157 | Good 93.9% |
| Bermudans | 71.0 /100 | #158 | Good 93.9% |
| Chileans | 70.2 /100 | #159 | Good 93.9% |
| Pakistanis | 70.1 /100 | #160 | Good 93.9% |
| Assyrians/Chaldeans/Syriacs | 69.7 /100 | #161 | Good 93.9% |
| Immigrants | Poland | 69.6 /100 | #162 | Good 93.9% |
| Venezuelans | 69.5 /100 | #163 | Good 93.9% |
| Iraqis | 68.1 /100 | #164 | Good 93.9% |
| Brazilians | 63.6 /100 | #165 | Good 93.8% |
| Immigrants | Iraq | 63.0 /100 | #166 | Good 93.8% |