Sri Lankan vs Immigrants from Belarus 7th Grade
COMPARE
Sri Lankan
Immigrants from Belarus
7th Grade
7th Grade Comparison
Sri Lankans
Immigrants from Belarus
94.4%
7TH GRADE
0.0/ 100
METRIC RATING
303rd/ 347
METRIC RANK
96.3%
7TH GRADE
82.4/ 100
METRIC RATING
150th/ 347
METRIC RANK
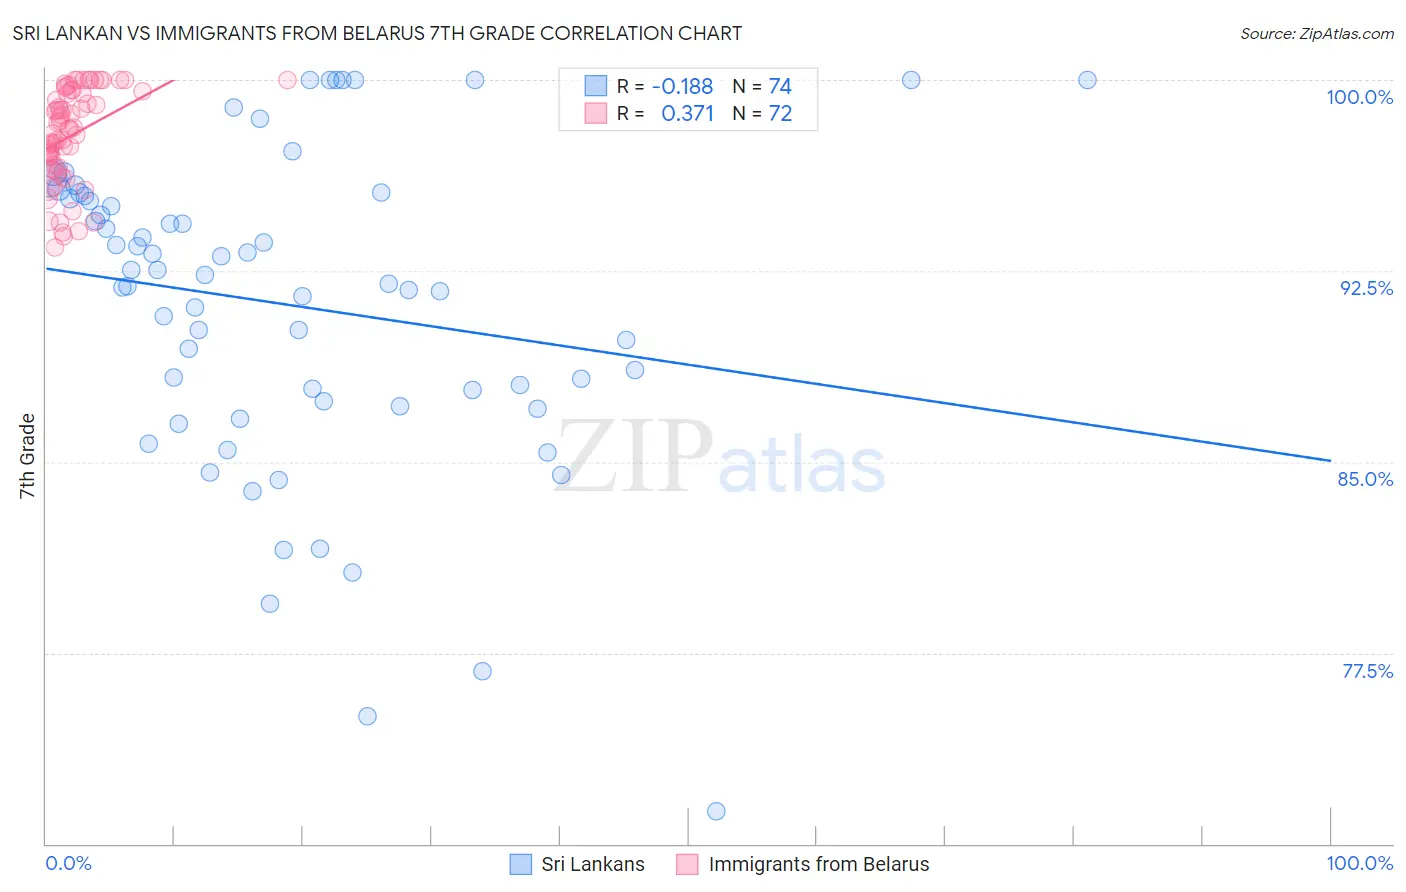
Sri Lankan vs Immigrants from Belarus 7th Grade Correlation Chart
The statistical analysis conducted on geographies consisting of 440,593,938 people shows a poor negative correlation between the proportion of Sri Lankans and percentage of population with at least 7th grade education in the United States with a correlation coefficient (R) of -0.188 and weighted average of 94.4%. Similarly, the statistical analysis conducted on geographies consisting of 149,993,317 people shows a mild positive correlation between the proportion of Immigrants from Belarus and percentage of population with at least 7th grade education in the United States with a correlation coefficient (R) of 0.371 and weighted average of 96.3%, a difference of 2.0%.
7th Grade Correlation Summary
| Measurement | Sri Lankan | Immigrants from Belarus |
| Minimum | 71.3% | 93.4% |
| Maximum | 100.0% | 100.0% |
| Range | 28.7% | 6.6% |
| Mean | 91.2% | 97.8% |
| Median | 92.2% | 98.1% |
| Interquartile 25% (IQ1) | 87.4% | 96.6% |
| Interquartile 75% (IQ3) | 95.5% | 99.5% |
| Interquartile Range (IQR) | 8.1% | 2.9% |
| Standard Deviation (Sample) | 6.2% | 1.8% |
| Standard Deviation (Population) | 6.2% | 1.8% |
Similar Demographics by 7th Grade
Demographics Similar to Sri Lankans by 7th Grade
In terms of 7th grade, the demographic groups most similar to Sri Lankans are Immigrants from Haiti (94.3%, a difference of 0.030%), Guyanese (94.3%, a difference of 0.060%), Immigrants from Laos (94.5%, a difference of 0.080%), Immigrants from Dominica (94.5%, a difference of 0.090%), and Immigrants from Burma/Myanmar (94.5%, a difference of 0.12%).
| Demographics | Rating | Rank | 7th Grade |
| Cubans | 0.0 /100 | #296 | Tragic 94.6% |
| Immigrants | South Eastern Asia | 0.0 /100 | #297 | Tragic 94.5% |
| Indonesians | 0.0 /100 | #298 | Tragic 94.5% |
| Bangladeshis | 0.0 /100 | #299 | Tragic 94.5% |
| Immigrants | Burma/Myanmar | 0.0 /100 | #300 | Tragic 94.5% |
| Immigrants | Dominica | 0.0 /100 | #301 | Tragic 94.5% |
| Immigrants | Laos | 0.0 /100 | #302 | Tragic 94.5% |
| Sri Lankans | 0.0 /100 | #303 | Tragic 94.4% |
| Immigrants | Haiti | 0.0 /100 | #304 | Tragic 94.3% |
| Guyanese | 0.0 /100 | #305 | Tragic 94.3% |
| Immigrants | Guyana | 0.0 /100 | #306 | Tragic 94.2% |
| Immigrants | Portugal | 0.0 /100 | #307 | Tragic 94.2% |
| Cape Verdeans | 0.0 /100 | #308 | Tragic 94.1% |
| Ecuadorians | 0.0 /100 | #309 | Tragic 94.0% |
| Immigrants | Caribbean | 0.0 /100 | #310 | Tragic 94.0% |
Demographics Similar to Immigrants from Belarus by 7th Grade
In terms of 7th grade, the demographic groups most similar to Immigrants from Belarus are Israeli (96.3%, a difference of 0.0%), Albanian (96.3%, a difference of 0.0%), Immigrants from Eastern Europe (96.3%, a difference of 0.010%), French American Indian (96.3%, a difference of 0.010%), and Hopi (96.3%, a difference of 0.010%).
| Demographics | Rating | Rank | 7th Grade |
| Spanish | 86.6 /100 | #143 | Excellent 96.3% |
| Immigrants | Greece | 85.9 /100 | #144 | Excellent 96.3% |
| Blackfeet | 83.9 /100 | #145 | Excellent 96.3% |
| Immigrants | Eastern Europe | 83.7 /100 | #146 | Excellent 96.3% |
| French American Indians | 83.1 /100 | #147 | Excellent 96.3% |
| Israelis | 82.8 /100 | #148 | Excellent 96.3% |
| Albanians | 82.6 /100 | #149 | Excellent 96.3% |
| Immigrants | Belarus | 82.4 /100 | #150 | Excellent 96.3% |
| Hopi | 81.6 /100 | #151 | Excellent 96.3% |
| Immigrants | Russia | 78.4 /100 | #152 | Good 96.2% |
| Seminole | 78.1 /100 | #153 | Good 96.2% |
| Immigrants | Israel | 77.6 /100 | #154 | Good 96.2% |
| Immigrants | Jordan | 77.0 /100 | #155 | Good 96.2% |
| Kenyans | 76.2 /100 | #156 | Good 96.2% |
| Ugandans | 75.5 /100 | #157 | Good 96.2% |