Nepalese vs Immigrants from Belarus 7th Grade
COMPARE
Nepalese
Immigrants from Belarus
7th Grade
7th Grade Comparison
Nepalese
Immigrants from Belarus
93.2%
7TH GRADE
0.0/ 100
METRIC RATING
326th/ 347
METRIC RANK
96.3%
7TH GRADE
82.4/ 100
METRIC RATING
150th/ 347
METRIC RANK
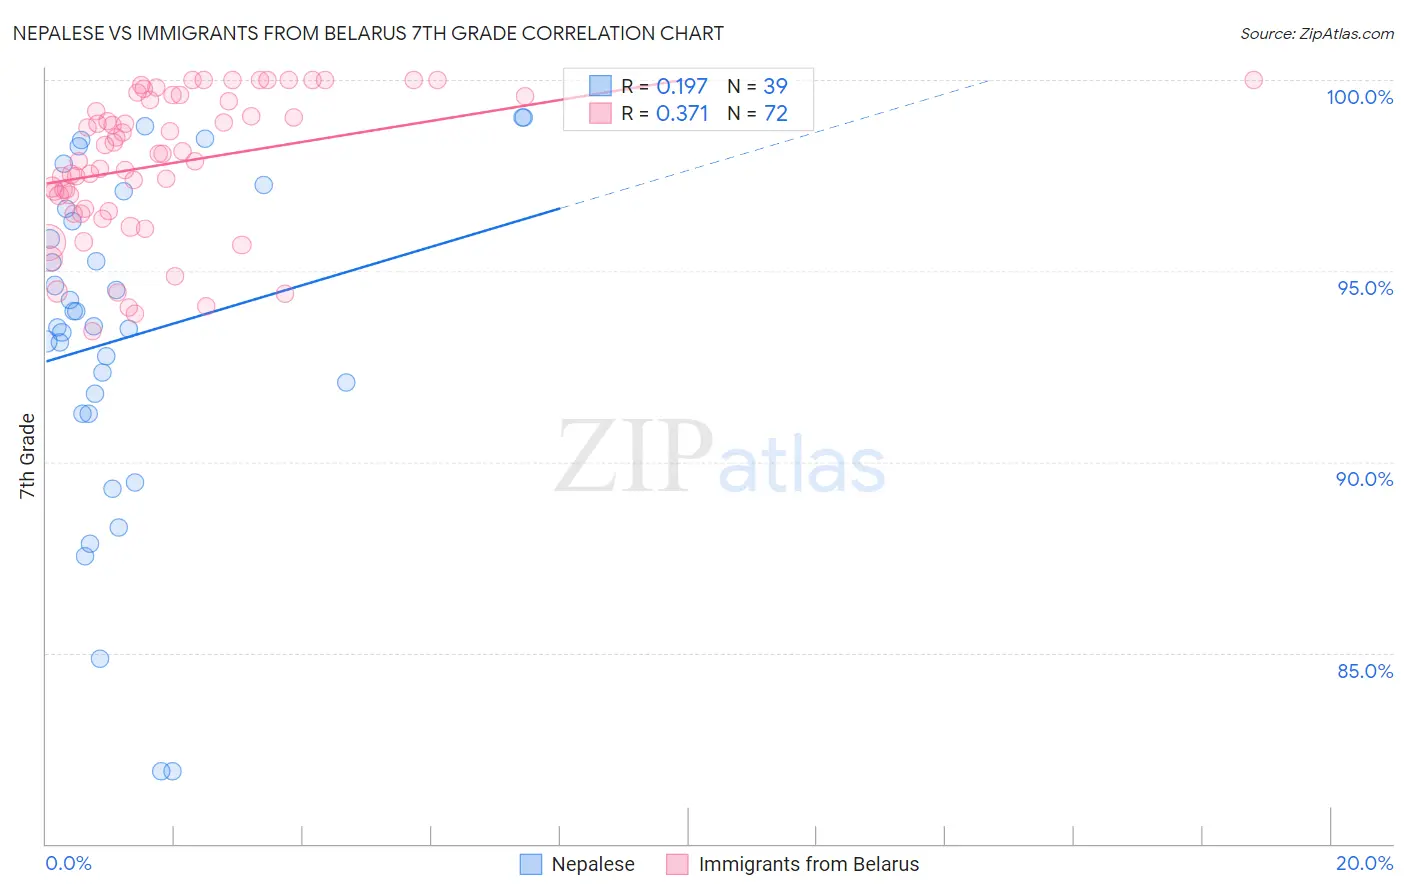
Nepalese vs Immigrants from Belarus 7th Grade Correlation Chart
The statistical analysis conducted on geographies consisting of 24,519,269 people shows a poor positive correlation between the proportion of Nepalese and percentage of population with at least 7th grade education in the United States with a correlation coefficient (R) of 0.197 and weighted average of 93.2%. Similarly, the statistical analysis conducted on geographies consisting of 149,993,317 people shows a mild positive correlation between the proportion of Immigrants from Belarus and percentage of population with at least 7th grade education in the United States with a correlation coefficient (R) of 0.371 and weighted average of 96.3%, a difference of 3.3%.
7th Grade Correlation Summary
| Measurement | Nepalese | Immigrants from Belarus |
| Minimum | 81.9% | 93.4% |
| Maximum | 99.0% | 100.0% |
| Range | 17.1% | 6.6% |
| Mean | 93.3% | 97.8% |
| Median | 93.6% | 98.1% |
| Interquartile 25% (IQ1) | 91.3% | 96.6% |
| Interquartile 75% (IQ3) | 96.6% | 99.5% |
| Interquartile Range (IQR) | 5.4% | 2.9% |
| Standard Deviation (Sample) | 4.4% | 1.8% |
| Standard Deviation (Population) | 4.3% | 1.8% |
Similar Demographics by 7th Grade
Demographics Similar to Nepalese by 7th Grade
In terms of 7th grade, the demographic groups most similar to Nepalese are Immigrants from Cabo Verde (93.1%, a difference of 0.070%), Central American Indian (93.3%, a difference of 0.11%), Dominican (93.3%, a difference of 0.18%), Immigrants from Belize (93.4%, a difference of 0.19%), and Immigrants from Nicaragua (93.0%, a difference of 0.20%).
| Demographics | Rating | Rank | 7th Grade |
| Immigrants | Cambodia | 0.0 /100 | #319 | Tragic 93.7% |
| Immigrants | Fiji | 0.0 /100 | #320 | Tragic 93.5% |
| Belizeans | 0.0 /100 | #321 | Tragic 93.5% |
| Nicaraguans | 0.0 /100 | #322 | Tragic 93.5% |
| Immigrants | Belize | 0.0 /100 | #323 | Tragic 93.4% |
| Dominicans | 0.0 /100 | #324 | Tragic 93.3% |
| Central American Indians | 0.0 /100 | #325 | Tragic 93.3% |
| Nepalese | 0.0 /100 | #326 | Tragic 93.2% |
| Immigrants | Cabo Verde | 0.0 /100 | #327 | Tragic 93.1% |
| Immigrants | Nicaragua | 0.0 /100 | #328 | Tragic 93.0% |
| Immigrants | Azores | 0.0 /100 | #329 | Tragic 93.0% |
| Immigrants | Dominican Republic | 0.0 /100 | #330 | Tragic 92.9% |
| Hondurans | 0.0 /100 | #331 | Tragic 92.9% |
| Hispanics or Latinos | 0.0 /100 | #332 | Tragic 92.7% |
| Immigrants | Armenia | 0.0 /100 | #333 | Tragic 92.7% |
Demographics Similar to Immigrants from Belarus by 7th Grade
In terms of 7th grade, the demographic groups most similar to Immigrants from Belarus are Israeli (96.3%, a difference of 0.0%), Albanian (96.3%, a difference of 0.0%), Immigrants from Eastern Europe (96.3%, a difference of 0.010%), French American Indian (96.3%, a difference of 0.010%), and Hopi (96.3%, a difference of 0.010%).
| Demographics | Rating | Rank | 7th Grade |
| Spanish | 86.6 /100 | #143 | Excellent 96.3% |
| Immigrants | Greece | 85.9 /100 | #144 | Excellent 96.3% |
| Blackfeet | 83.9 /100 | #145 | Excellent 96.3% |
| Immigrants | Eastern Europe | 83.7 /100 | #146 | Excellent 96.3% |
| French American Indians | 83.1 /100 | #147 | Excellent 96.3% |
| Israelis | 82.8 /100 | #148 | Excellent 96.3% |
| Albanians | 82.6 /100 | #149 | Excellent 96.3% |
| Immigrants | Belarus | 82.4 /100 | #150 | Excellent 96.3% |
| Hopi | 81.6 /100 | #151 | Excellent 96.3% |
| Immigrants | Russia | 78.4 /100 | #152 | Good 96.2% |
| Seminole | 78.1 /100 | #153 | Good 96.2% |
| Immigrants | Israel | 77.6 /100 | #154 | Good 96.2% |
| Immigrants | Jordan | 77.0 /100 | #155 | Good 96.2% |
| Kenyans | 76.2 /100 | #156 | Good 96.2% |
| Ugandans | 75.5 /100 | #157 | Good 96.2% |