Mexican vs Immigrants from Belarus 7th Grade
COMPARE
Mexican
Immigrants from Belarus
7th Grade
7th Grade Comparison
Mexicans
Immigrants from Belarus
91.9%
7TH GRADE
0.0/ 100
METRIC RATING
339th/ 347
METRIC RANK
96.3%
7TH GRADE
82.4/ 100
METRIC RATING
150th/ 347
METRIC RANK
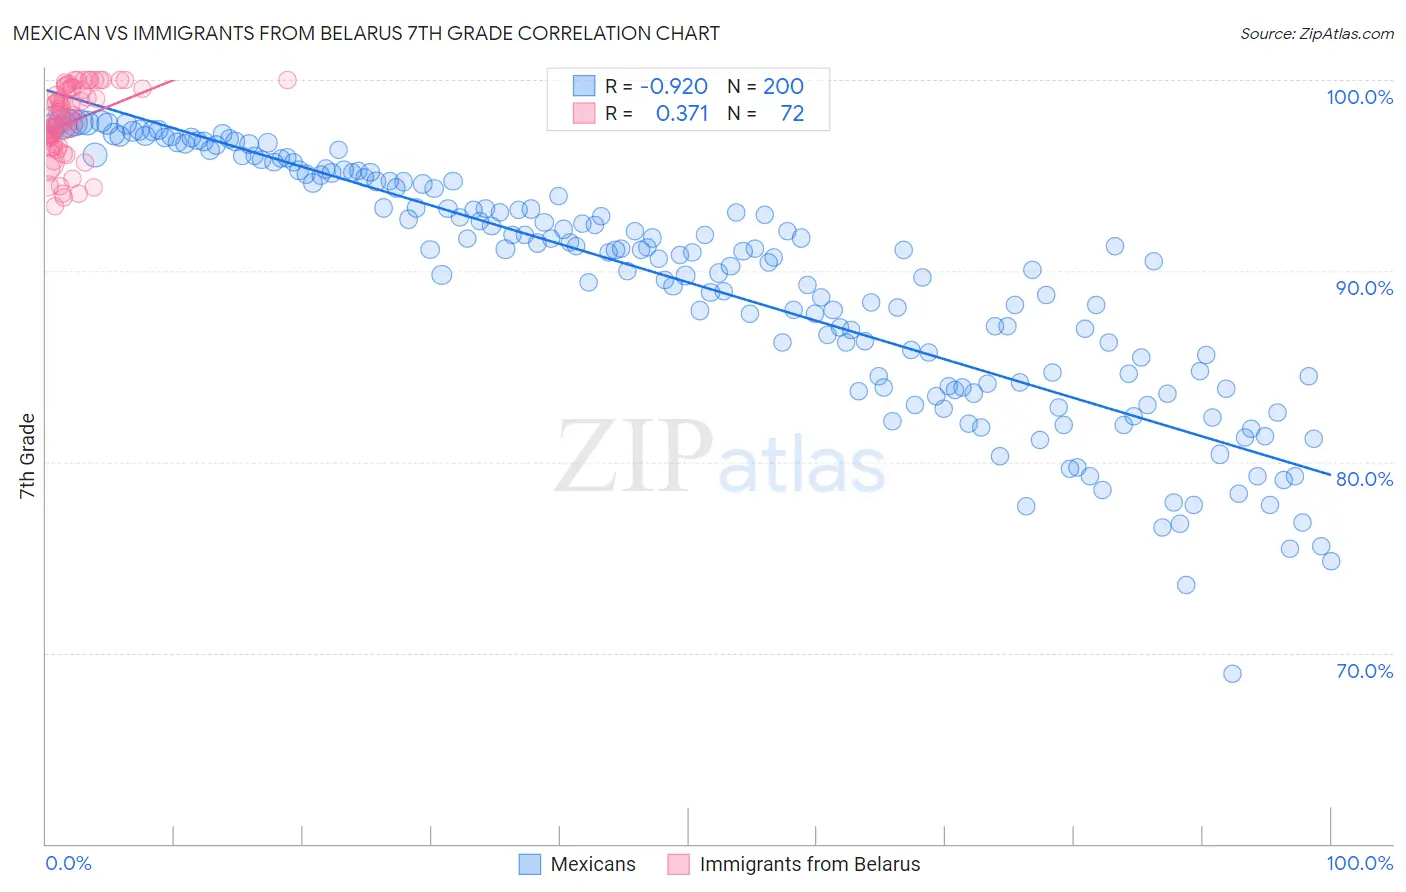
Mexican vs Immigrants from Belarus 7th Grade Correlation Chart
The statistical analysis conducted on geographies consisting of 565,339,785 people shows a near-perfect negative correlation between the proportion of Mexicans and percentage of population with at least 7th grade education in the United States with a correlation coefficient (R) of -0.920 and weighted average of 91.9%. Similarly, the statistical analysis conducted on geographies consisting of 149,993,317 people shows a mild positive correlation between the proportion of Immigrants from Belarus and percentage of population with at least 7th grade education in the United States with a correlation coefficient (R) of 0.371 and weighted average of 96.3%, a difference of 4.8%.
7th Grade Correlation Summary
| Measurement | Mexican | Immigrants from Belarus |
| Minimum | 68.9% | 93.4% |
| Maximum | 97.9% | 100.0% |
| Range | 29.0% | 6.6% |
| Mean | 89.4% | 97.8% |
| Median | 91.0% | 98.1% |
| Interquartile 25% (IQ1) | 84.3% | 96.6% |
| Interquartile 75% (IQ3) | 94.8% | 99.5% |
| Interquartile Range (IQR) | 10.5% | 2.9% |
| Standard Deviation (Sample) | 6.3% | 1.8% |
| Standard Deviation (Population) | 6.3% | 1.8% |
Similar Demographics by 7th Grade
Demographics Similar to Mexicans by 7th Grade
In terms of 7th grade, the demographic groups most similar to Mexicans are Yakama (91.7%, a difference of 0.20%), Guatemalan (91.7%, a difference of 0.21%), Central American (92.1%, a difference of 0.25%), Immigrants from Latin America (92.2%, a difference of 0.38%), and Salvadoran (91.5%, a difference of 0.49%).
| Demographics | Rating | Rank | 7th Grade |
| Hispanics or Latinos | 0.0 /100 | #332 | Tragic 92.7% |
| Immigrants | Armenia | 0.0 /100 | #333 | Tragic 92.7% |
| Immigrants | Yemen | 0.0 /100 | #334 | Tragic 92.6% |
| Mexican American Indians | 0.0 /100 | #335 | Tragic 92.6% |
| Immigrants | Honduras | 0.0 /100 | #336 | Tragic 92.5% |
| Immigrants | Latin America | 0.0 /100 | #337 | Tragic 92.2% |
| Central Americans | 0.0 /100 | #338 | Tragic 92.1% |
| Mexicans | 0.0 /100 | #339 | Tragic 91.9% |
| Yakama | 0.0 /100 | #340 | Tragic 91.7% |
| Guatemalans | 0.0 /100 | #341 | Tragic 91.7% |
| Salvadorans | 0.0 /100 | #342 | Tragic 91.5% |
| Immigrants | Guatemala | 0.0 /100 | #343 | Tragic 91.3% |
| Immigrants | Central America | 0.0 /100 | #344 | Tragic 91.0% |
| Immigrants | El Salvador | 0.0 /100 | #345 | Tragic 90.9% |
| Immigrants | Mexico | 0.0 /100 | #346 | Tragic 90.7% |
Demographics Similar to Immigrants from Belarus by 7th Grade
In terms of 7th grade, the demographic groups most similar to Immigrants from Belarus are Israeli (96.3%, a difference of 0.0%), Albanian (96.3%, a difference of 0.0%), Immigrants from Eastern Europe (96.3%, a difference of 0.010%), French American Indian (96.3%, a difference of 0.010%), and Hopi (96.3%, a difference of 0.010%).
| Demographics | Rating | Rank | 7th Grade |
| Spanish | 86.6 /100 | #143 | Excellent 96.3% |
| Immigrants | Greece | 85.9 /100 | #144 | Excellent 96.3% |
| Blackfeet | 83.9 /100 | #145 | Excellent 96.3% |
| Immigrants | Eastern Europe | 83.7 /100 | #146 | Excellent 96.3% |
| French American Indians | 83.1 /100 | #147 | Excellent 96.3% |
| Israelis | 82.8 /100 | #148 | Excellent 96.3% |
| Albanians | 82.6 /100 | #149 | Excellent 96.3% |
| Immigrants | Belarus | 82.4 /100 | #150 | Excellent 96.3% |
| Hopi | 81.6 /100 | #151 | Excellent 96.3% |
| Immigrants | Russia | 78.4 /100 | #152 | Good 96.2% |
| Seminole | 78.1 /100 | #153 | Good 96.2% |
| Immigrants | Israel | 77.6 /100 | #154 | Good 96.2% |
| Immigrants | Jordan | 77.0 /100 | #155 | Good 96.2% |
| Kenyans | 76.2 /100 | #156 | Good 96.2% |
| Ugandans | 75.5 /100 | #157 | Good 96.2% |