Paraguayan vs Immigrants from Belarus 10th Grade
COMPARE
Paraguayan
Immigrants from Belarus
10th Grade
10th Grade Comparison
Paraguayans
Immigrants from Belarus
93.7%
10TH GRADE
45.3/ 100
METRIC RATING
179th/ 347
METRIC RANK
94.4%
10TH GRADE
95.2/ 100
METRIC RATING
121st/ 347
METRIC RANK
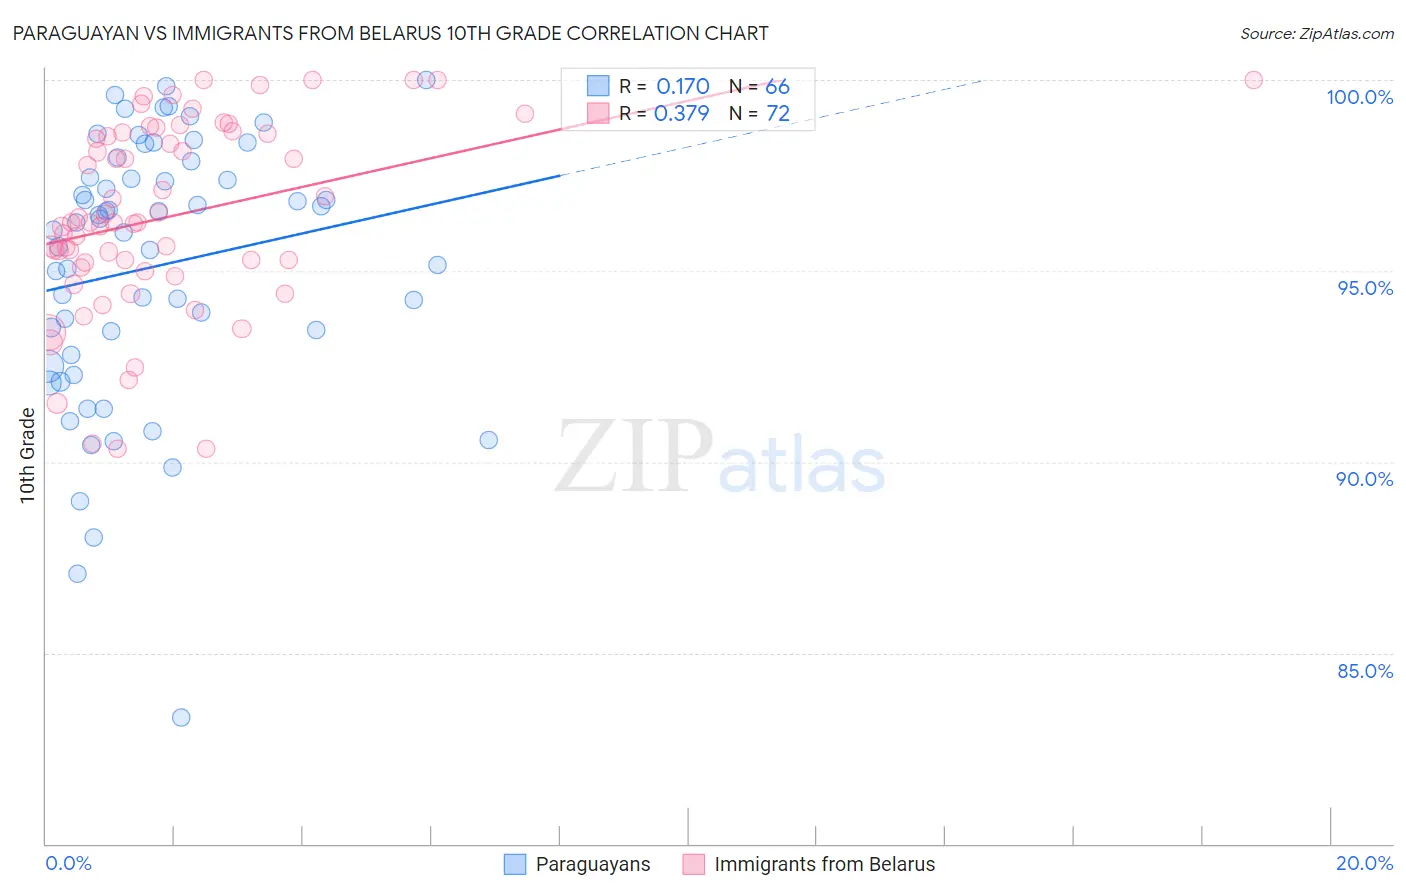
Paraguayan vs Immigrants from Belarus 10th Grade Correlation Chart
The statistical analysis conducted on geographies consisting of 95,114,201 people shows a poor positive correlation between the proportion of Paraguayans and percentage of population with at least 10th grade education in the United States with a correlation coefficient (R) of 0.170 and weighted average of 93.7%. Similarly, the statistical analysis conducted on geographies consisting of 149,993,317 people shows a mild positive correlation between the proportion of Immigrants from Belarus and percentage of population with at least 10th grade education in the United States with a correlation coefficient (R) of 0.379 and weighted average of 94.4%, a difference of 0.71%.
10th Grade Correlation Summary
| Measurement | Paraguayan | Immigrants from Belarus |
| Minimum | 83.3% | 90.3% |
| Maximum | 100.0% | 100.0% |
| Range | 16.7% | 9.7% |
| Mean | 95.1% | 96.4% |
| Median | 96.2% | 96.3% |
| Interquartile 25% (IQ1) | 92.8% | 95.2% |
| Interquartile 75% (IQ3) | 97.4% | 98.6% |
| Interquartile Range (IQR) | 4.7% | 3.4% |
| Standard Deviation (Sample) | 3.5% | 2.5% |
| Standard Deviation (Population) | 3.4% | 2.5% |
Similar Demographics by 10th Grade
Demographics Similar to Paraguayans by 10th Grade
In terms of 10th grade, the demographic groups most similar to Paraguayans are Sierra Leonean (93.7%, a difference of 0.010%), Immigrants from Argentina (93.7%, a difference of 0.020%), Immigrants from Lebanon (93.7%, a difference of 0.020%), Blackfeet (93.7%, a difference of 0.020%), and Immigrants from Northern Africa (93.7%, a difference of 0.030%).
| Demographics | Rating | Rank | 10th Grade |
| French American Indians | 50.9 /100 | #172 | Average 93.7% |
| Spaniards | 50.3 /100 | #173 | Average 93.7% |
| Argentineans | 50.0 /100 | #174 | Average 93.7% |
| Immigrants | Nepal | 49.6 /100 | #175 | Average 93.7% |
| Immigrants | Argentina | 47.1 /100 | #176 | Average 93.7% |
| Immigrants | Lebanon | 47.1 /100 | #177 | Average 93.7% |
| Sierra Leoneans | 46.1 /100 | #178 | Average 93.7% |
| Paraguayans | 45.3 /100 | #179 | Average 93.7% |
| Blackfeet | 42.8 /100 | #180 | Average 93.7% |
| Immigrants | Northern Africa | 41.6 /100 | #181 | Average 93.7% |
| Colville | 38.8 /100 | #182 | Fair 93.6% |
| Guamanians/Chamorros | 37.1 /100 | #183 | Fair 93.6% |
| Choctaw | 36.6 /100 | #184 | Fair 93.6% |
| Sudanese | 36.6 /100 | #185 | Fair 93.6% |
| Immigrants | Eastern Asia | 35.1 /100 | #186 | Fair 93.6% |
Demographics Similar to Immigrants from Belarus by 10th Grade
In terms of 10th grade, the demographic groups most similar to Immigrants from Belarus are Inupiat (94.4%, a difference of 0.0%), Cree (94.4%, a difference of 0.0%), Immigrants from Israel (94.4%, a difference of 0.010%), Immigrants from Taiwan (94.4%, a difference of 0.010%), and Basque (94.3%, a difference of 0.010%).
| Demographics | Rating | Rank | 10th Grade |
| German Russians | 96.3 /100 | #114 | Exceptional 94.4% |
| Delaware | 96.3 /100 | #115 | Exceptional 94.4% |
| Sioux | 96.2 /100 | #116 | Exceptional 94.4% |
| Immigrants | Hungary | 95.8 /100 | #117 | Exceptional 94.4% |
| Jordanians | 95.6 /100 | #118 | Exceptional 94.4% |
| Immigrants | Israel | 95.4 /100 | #119 | Exceptional 94.4% |
| Immigrants | Taiwan | 95.3 /100 | #120 | Exceptional 94.4% |
| Immigrants | Belarus | 95.2 /100 | #121 | Exceptional 94.4% |
| Inupiat | 95.1 /100 | #122 | Exceptional 94.4% |
| Cree | 95.1 /100 | #123 | Exceptional 94.4% |
| Basques | 94.9 /100 | #124 | Exceptional 94.3% |
| Americans | 94.4 /100 | #125 | Exceptional 94.3% |
| Immigrants | Iran | 94.4 /100 | #126 | Exceptional 94.3% |
| Israelis | 93.8 /100 | #127 | Exceptional 94.3% |
| Potawatomi | 93.6 /100 | #128 | Exceptional 94.3% |