Spanish American vs Croatian Unemployment Among Ages 60 to 64 years
COMPARE
Spanish American
Croatian
Unemployment Among Ages 60 to 64 years
Unemployment Among Ages 60 to 64 years Comparison
Spanish Americans
Croatians
5.3%
UNEMPLOYMENT AMONG AGES 60 TO 64 YEARS
0.0/ 100
METRIC RATING
289th/ 347
METRIC RANK
4.6%
UNEMPLOYMENT AMONG AGES 60 TO 64 YEARS
99.5/ 100
METRIC RATING
70th/ 347
METRIC RANK
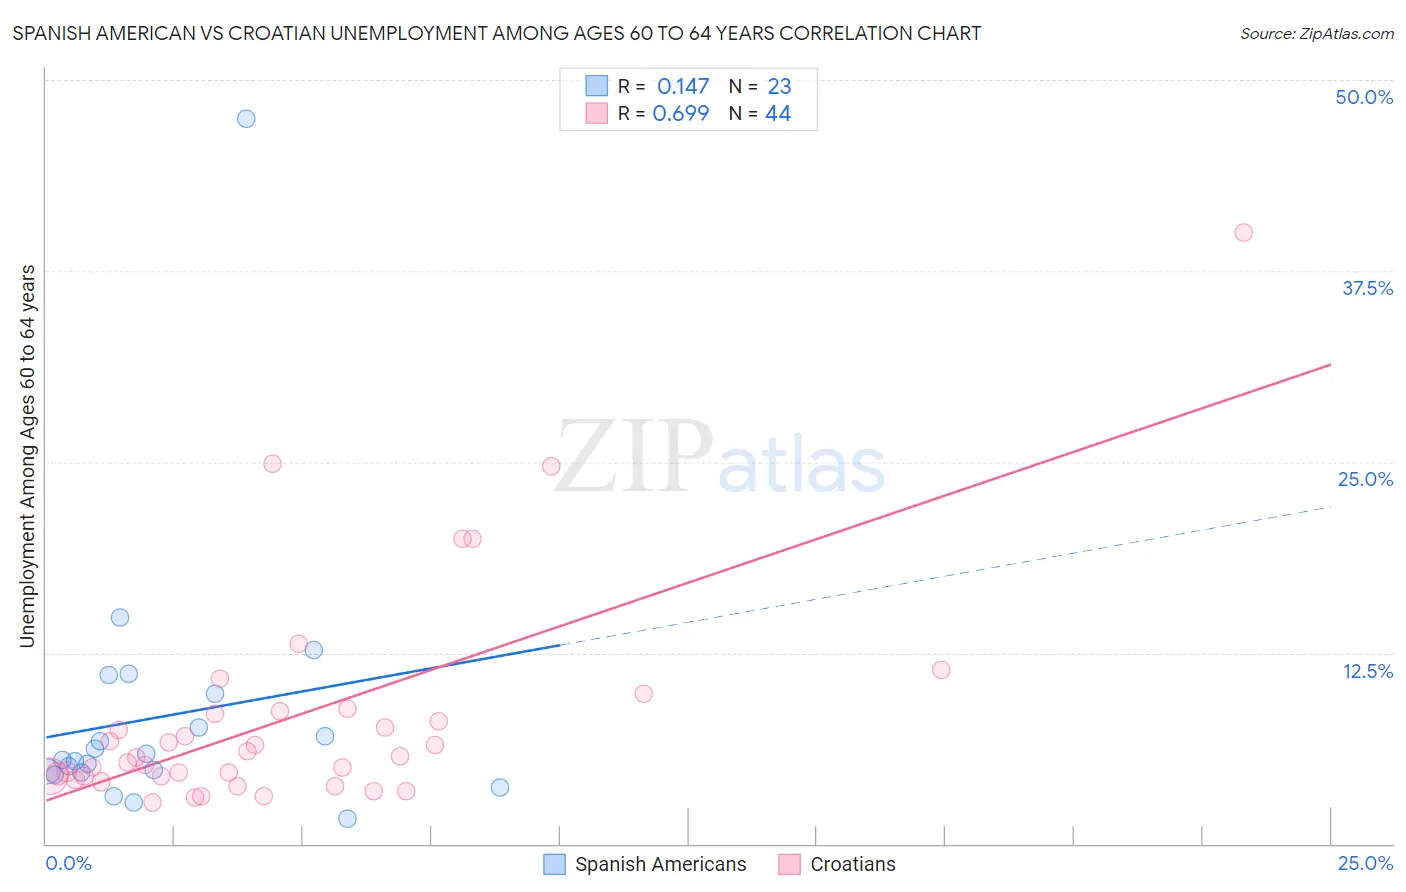
Spanish American vs Croatian Unemployment Among Ages 60 to 64 years Correlation Chart
The statistical analysis conducted on geographies consisting of 100,266,339 people shows a poor positive correlation between the proportion of Spanish Americans and unemployment rate among population between the ages 60 and 64 in the United States with a correlation coefficient (R) of 0.147 and weighted average of 5.3%. Similarly, the statistical analysis conducted on geographies consisting of 339,281,075 people shows a significant positive correlation between the proportion of Croatians and unemployment rate among population between the ages 60 and 64 in the United States with a correlation coefficient (R) of 0.699 and weighted average of 4.6%, a difference of 14.3%.
Unemployment Among Ages 60 to 64 years Correlation Summary
| Measurement | Spanish American | Croatian |
| Minimum | 1.6% | 2.7% |
| Maximum | 47.5% | 40.0% |
| Range | 45.9% | 37.3% |
| Mean | 8.3% | 8.2% |
| Median | 5.5% | 5.7% |
| Interquartile 25% (IQ1) | 4.6% | 4.4% |
| Interquartile 75% (IQ3) | 9.8% | 8.6% |
| Interquartile Range (IQR) | 5.2% | 4.2% |
| Standard Deviation (Sample) | 9.2% | 7.3% |
| Standard Deviation (Population) | 9.0% | 7.2% |
Similar Demographics by Unemployment Among Ages 60 to 64 years
Demographics Similar to Spanish Americans by Unemployment Among Ages 60 to 64 years
In terms of unemployment among ages 60 to 64 years, the demographic groups most similar to Spanish Americans are Trinidadian and Tobagonian (5.3%, a difference of 0.030%), Immigrants from Trinidad and Tobago (5.3%, a difference of 0.030%), Salvadoran (5.3%, a difference of 0.21%), Mexican American Indian (5.3%, a difference of 0.25%), and Hispanic or Latino (5.3%, a difference of 0.35%).
| Demographics | Rating | Rank | Unemployment Among Ages 60 to 64 years |
| Mexicans | 0.0 /100 | #282 | Tragic 5.2% |
| Immigrants | Guatemala | 0.0 /100 | #283 | Tragic 5.3% |
| Taiwanese | 0.0 /100 | #284 | Tragic 5.3% |
| West Indians | 0.0 /100 | #285 | Tragic 5.3% |
| Mexican American Indians | 0.0 /100 | #286 | Tragic 5.3% |
| Salvadorans | 0.0 /100 | #287 | Tragic 5.3% |
| Trinidadians and Tobagonians | 0.0 /100 | #288 | Tragic 5.3% |
| Spanish Americans | 0.0 /100 | #289 | Tragic 5.3% |
| Immigrants | Trinidad and Tobago | 0.0 /100 | #290 | Tragic 5.3% |
| Hispanics or Latinos | 0.0 /100 | #291 | Tragic 5.3% |
| Immigrants | Latin America | 0.0 /100 | #292 | Tragic 5.3% |
| Immigrants | Israel | 0.0 /100 | #293 | Tragic 5.3% |
| Blacks/African Americans | 0.0 /100 | #294 | Tragic 5.3% |
| Armenians | 0.0 /100 | #295 | Tragic 5.3% |
| Jamaicans | 0.0 /100 | #296 | Tragic 5.3% |
Demographics Similar to Croatians by Unemployment Among Ages 60 to 64 years
In terms of unemployment among ages 60 to 64 years, the demographic groups most similar to Croatians are Creek (4.6%, a difference of 0.080%), Slavic (4.6%, a difference of 0.080%), Tongan (4.6%, a difference of 0.090%), Immigrants from Eastern Africa (4.6%, a difference of 0.11%), and Immigrants from Laos (4.6%, a difference of 0.18%).
| Demographics | Rating | Rank | Unemployment Among Ages 60 to 64 years |
| Czechoslovakians | 99.7 /100 | #63 | Exceptional 4.6% |
| Immigrants | Middle Africa | 99.7 /100 | #64 | Exceptional 4.6% |
| Jordanians | 99.7 /100 | #65 | Exceptional 4.6% |
| Hawaiians | 99.6 /100 | #66 | Exceptional 4.6% |
| Immigrants | Scotland | 99.6 /100 | #67 | Exceptional 4.6% |
| Immigrants | Laos | 99.6 /100 | #68 | Exceptional 4.6% |
| Creek | 99.6 /100 | #69 | Exceptional 4.6% |
| Croatians | 99.5 /100 | #70 | Exceptional 4.6% |
| Slavs | 99.5 /100 | #71 | Exceptional 4.6% |
| Tongans | 99.5 /100 | #72 | Exceptional 4.6% |
| Immigrants | Eastern Africa | 99.5 /100 | #73 | Exceptional 4.6% |
| Northern Europeans | 99.3 /100 | #74 | Exceptional 4.6% |
| Potawatomi | 99.3 /100 | #75 | Exceptional 4.6% |
| Slovaks | 99.3 /100 | #76 | Exceptional 4.6% |
| Immigrants | Somalia | 99.2 /100 | #77 | Exceptional 4.6% |