Spanish American vs Finnish Doctorate Degree
COMPARE
Spanish American
Finnish
Doctorate Degree
Doctorate Degree Comparison
Spanish Americans
Finns
1.7%
DOCTORATE DEGREE
12.9/ 100
METRIC RATING
217th/ 347
METRIC RANK
1.8%
DOCTORATE DEGREE
42.1/ 100
METRIC RATING
183rd/ 347
METRIC RANK
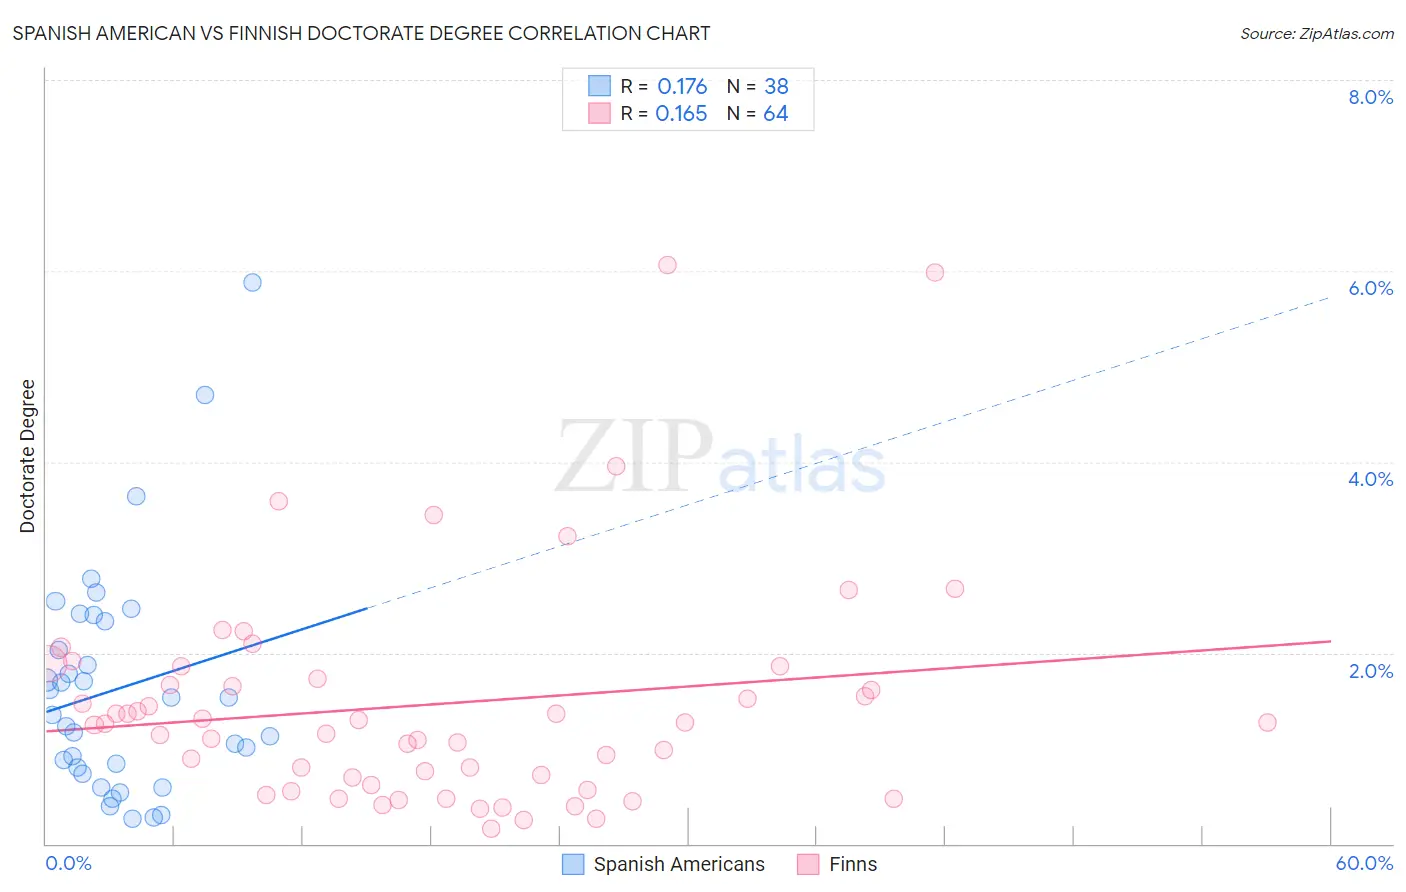
Spanish American vs Finnish Doctorate Degree Correlation Chart
The statistical analysis conducted on geographies consisting of 102,813,703 people shows a poor positive correlation between the proportion of Spanish Americans and percentage of population with at least doctorate degree education in the United States with a correlation coefficient (R) of 0.176 and weighted average of 1.7%. Similarly, the statistical analysis conducted on geographies consisting of 399,063,308 people shows a poor positive correlation between the proportion of Finns and percentage of population with at least doctorate degree education in the United States with a correlation coefficient (R) of 0.165 and weighted average of 1.8%, a difference of 6.3%.
Doctorate Degree Correlation Summary
| Measurement | Spanish American | Finnish |
| Minimum | 0.26% | 0.15% |
| Maximum | 5.9% | 6.1% |
| Range | 5.6% | 5.9% |
| Mean | 1.6% | 1.5% |
| Median | 1.4% | 1.3% |
| Interquartile 25% (IQ1) | 0.80% | 0.66% |
| Interquartile 75% (IQ3) | 2.3% | 1.8% |
| Interquartile Range (IQR) | 1.5% | 1.1% |
| Standard Deviation (Sample) | 1.2% | 1.2% |
| Standard Deviation (Population) | 1.2% | 1.2% |
Similar Demographics by Doctorate Degree
Demographics Similar to Spanish Americans by Doctorate Degree
In terms of doctorate degree, the demographic groups most similar to Spanish Americans are Immigrants from Burma/Myanmar (1.7%, a difference of 0.21%), Alaskan Athabascan (1.7%, a difference of 0.31%), Tlingit-Haida (1.7%, a difference of 0.37%), Korean (1.7%, a difference of 0.45%), and Pueblo (1.7%, a difference of 0.45%).
| Demographics | Rating | Rank | Doctorate Degree |
| Tongans | 15.1 /100 | #210 | Poor 1.7% |
| Immigrants | Armenia | 15.1 /100 | #211 | Poor 1.7% |
| Immigrants | South Eastern Asia | 14.7 /100 | #212 | Poor 1.7% |
| Koreans | 14.2 /100 | #213 | Poor 1.7% |
| Pueblo | 14.2 /100 | #214 | Poor 1.7% |
| Alaskan Athabascans | 13.8 /100 | #215 | Poor 1.7% |
| Immigrants | Burma/Myanmar | 13.5 /100 | #216 | Poor 1.7% |
| Spanish Americans | 12.9 /100 | #217 | Poor 1.7% |
| Tlingit-Haida | 11.9 /100 | #218 | Poor 1.7% |
| Immigrants | Iraq | 10.7 /100 | #219 | Poor 1.7% |
| Immigrants | Uruguay | 9.2 /100 | #220 | Tragic 1.7% |
| Immigrants | Nonimmigrants | 8.8 /100 | #221 | Tragic 1.7% |
| Immigrants | Venezuela | 8.7 /100 | #222 | Tragic 1.7% |
| Immigrants | Bosnia and Herzegovina | 7.8 /100 | #223 | Tragic 1.7% |
| Immigrants | Poland | 7.4 /100 | #224 | Tragic 1.7% |
Demographics Similar to Finns by Doctorate Degree
In terms of doctorate degree, the demographic groups most similar to Finns are Nigerian (1.8%, a difference of 0.33%), Immigrants from Afghanistan (1.8%, a difference of 0.34%), Immigrants (1.8%, a difference of 0.63%), Scandinavian (1.8%, a difference of 0.89%), and Slovak (1.8%, a difference of 0.90%).
| Demographics | Rating | Rank | Doctorate Degree |
| Spanish | 49.3 /100 | #176 | Average 1.8% |
| Iraqis | 49.2 /100 | #177 | Average 1.8% |
| French | 48.8 /100 | #178 | Average 1.8% |
| Ghanaians | 48.3 /100 | #179 | Average 1.8% |
| Scandinavians | 48.0 /100 | #180 | Average 1.8% |
| Immigrants | Immigrants | 46.2 /100 | #181 | Average 1.8% |
| Immigrants | Afghanistan | 44.3 /100 | #182 | Average 1.8% |
| Finns | 42.1 /100 | #183 | Average 1.8% |
| Nigerians | 39.9 /100 | #184 | Fair 1.8% |
| Slovaks | 36.4 /100 | #185 | Fair 1.8% |
| Peruvians | 34.4 /100 | #186 | Fair 1.8% |
| Czechoslovakians | 33.0 /100 | #187 | Fair 1.8% |
| Germans | 30.5 /100 | #188 | Fair 1.8% |
| French Canadians | 30.2 /100 | #189 | Fair 1.8% |
| Immigrants | Costa Rica | 30.2 /100 | #190 | Fair 1.8% |