Spanish American vs Romanian Doctorate Degree
COMPARE
Spanish American
Romanian
Doctorate Degree
Doctorate Degree Comparison
Spanish Americans
Romanians
1.7%
DOCTORATE DEGREE
12.9/ 100
METRIC RATING
217th/ 347
METRIC RANK
2.1%
DOCTORATE DEGREE
98.1/ 100
METRIC RATING
103rd/ 347
METRIC RANK
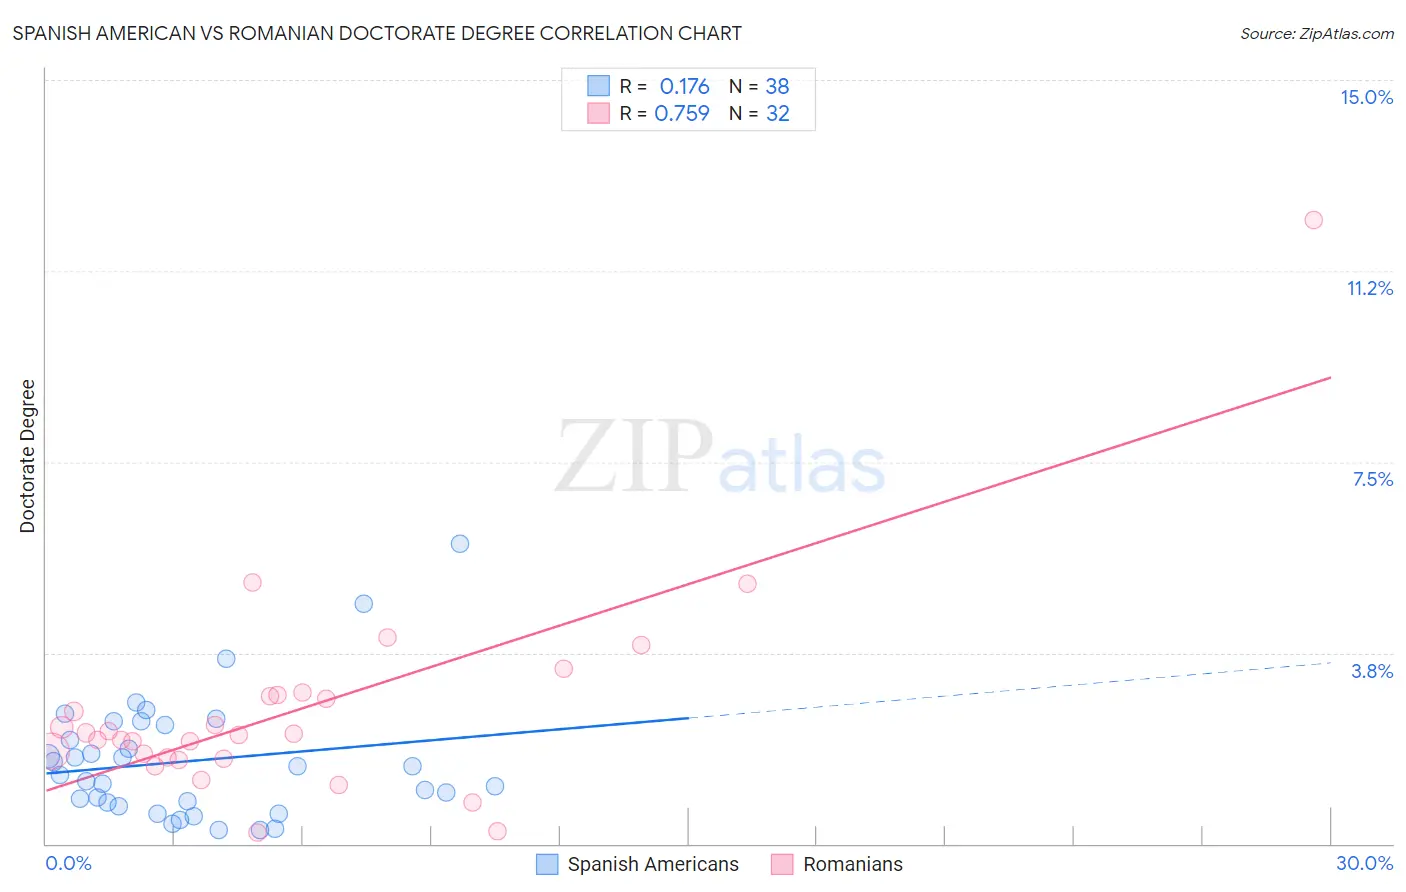
Spanish American vs Romanian Doctorate Degree Correlation Chart
The statistical analysis conducted on geographies consisting of 102,813,703 people shows a poor positive correlation between the proportion of Spanish Americans and percentage of population with at least doctorate degree education in the United States with a correlation coefficient (R) of 0.176 and weighted average of 1.7%. Similarly, the statistical analysis conducted on geographies consisting of 374,979,448 people shows a strong positive correlation between the proportion of Romanians and percentage of population with at least doctorate degree education in the United States with a correlation coefficient (R) of 0.759 and weighted average of 2.1%, a difference of 23.1%.
Doctorate Degree Correlation Summary
| Measurement | Spanish American | Romanian |
| Minimum | 0.26% | 0.21% |
| Maximum | 5.9% | 12.2% |
| Range | 5.6% | 12.0% |
| Mean | 1.6% | 2.6% |
| Median | 1.4% | 2.1% |
| Interquartile 25% (IQ1) | 0.80% | 1.7% |
| Interquartile 75% (IQ3) | 2.3% | 2.9% |
| Interquartile Range (IQR) | 1.5% | 1.2% |
| Standard Deviation (Sample) | 1.2% | 2.1% |
| Standard Deviation (Population) | 1.2% | 2.1% |
Similar Demographics by Doctorate Degree
Demographics Similar to Spanish Americans by Doctorate Degree
In terms of doctorate degree, the demographic groups most similar to Spanish Americans are Immigrants from Burma/Myanmar (1.7%, a difference of 0.21%), Alaskan Athabascan (1.7%, a difference of 0.31%), Tlingit-Haida (1.7%, a difference of 0.37%), Korean (1.7%, a difference of 0.45%), and Pueblo (1.7%, a difference of 0.45%).
| Demographics | Rating | Rank | Doctorate Degree |
| Tongans | 15.1 /100 | #210 | Poor 1.7% |
| Immigrants | Armenia | 15.1 /100 | #211 | Poor 1.7% |
| Immigrants | South Eastern Asia | 14.7 /100 | #212 | Poor 1.7% |
| Koreans | 14.2 /100 | #213 | Poor 1.7% |
| Pueblo | 14.2 /100 | #214 | Poor 1.7% |
| Alaskan Athabascans | 13.8 /100 | #215 | Poor 1.7% |
| Immigrants | Burma/Myanmar | 13.5 /100 | #216 | Poor 1.7% |
| Spanish Americans | 12.9 /100 | #217 | Poor 1.7% |
| Tlingit-Haida | 11.9 /100 | #218 | Poor 1.7% |
| Immigrants | Iraq | 10.7 /100 | #219 | Poor 1.7% |
| Immigrants | Uruguay | 9.2 /100 | #220 | Tragic 1.7% |
| Immigrants | Nonimmigrants | 8.8 /100 | #221 | Tragic 1.7% |
| Immigrants | Venezuela | 8.7 /100 | #222 | Tragic 1.7% |
| Immigrants | Bosnia and Herzegovina | 7.8 /100 | #223 | Tragic 1.7% |
| Immigrants | Poland | 7.4 /100 | #224 | Tragic 1.7% |
Demographics Similar to Romanians by Doctorate Degree
In terms of doctorate degree, the demographic groups most similar to Romanians are Immigrants from Chile (2.1%, a difference of 0.010%), Austrian (2.1%, a difference of 0.12%), Immigrants from Eastern Africa (2.1%, a difference of 0.23%), Immigrants from Eastern Europe (2.1%, a difference of 0.26%), and Immigrants from Egypt (2.1%, a difference of 0.27%).
| Demographics | Rating | Rank | Doctorate Degree |
| Immigrants | Northern Africa | 98.4 /100 | #96 | Exceptional 2.1% |
| Immigrants | Eritrea | 98.4 /100 | #97 | Exceptional 2.1% |
| Armenians | 98.3 /100 | #98 | Exceptional 2.1% |
| Immigrants | Egypt | 98.2 /100 | #99 | Exceptional 2.1% |
| Immigrants | Eastern Europe | 98.2 /100 | #100 | Exceptional 2.1% |
| Immigrants | Eastern Africa | 98.2 /100 | #101 | Exceptional 2.1% |
| Immigrants | Chile | 98.1 /100 | #102 | Exceptional 2.1% |
| Romanians | 98.1 /100 | #103 | Exceptional 2.1% |
| Austrians | 98.0 /100 | #104 | Exceptional 2.1% |
| Arabs | 97.8 /100 | #105 | Exceptional 2.1% |
| Sudanese | 97.7 /100 | #106 | Exceptional 2.1% |
| Europeans | 97.5 /100 | #107 | Exceptional 2.1% |
| Immigrants | Germany | 97.3 /100 | #108 | Exceptional 2.1% |
| Ukrainians | 97.2 /100 | #109 | Exceptional 2.1% |
| Brazilians | 97.2 /100 | #110 | Exceptional 2.1% |