Spanish American Indian vs Immigrants from Zaire College, 1 year or more
COMPARE
Spanish American Indian
Immigrants from Zaire
College, 1 year or more
College, 1 year or more Comparison
Spanish American Indians
Immigrants from Zaire
48.5%
COLLEGE, 1 YEAR OR MORE
0.0/ 100
METRIC RATING
336th/ 347
METRIC RANK
58.3%
COLLEGE, 1 YEAR OR MORE
18.7/ 100
METRIC RATING
205th/ 347
METRIC RANK
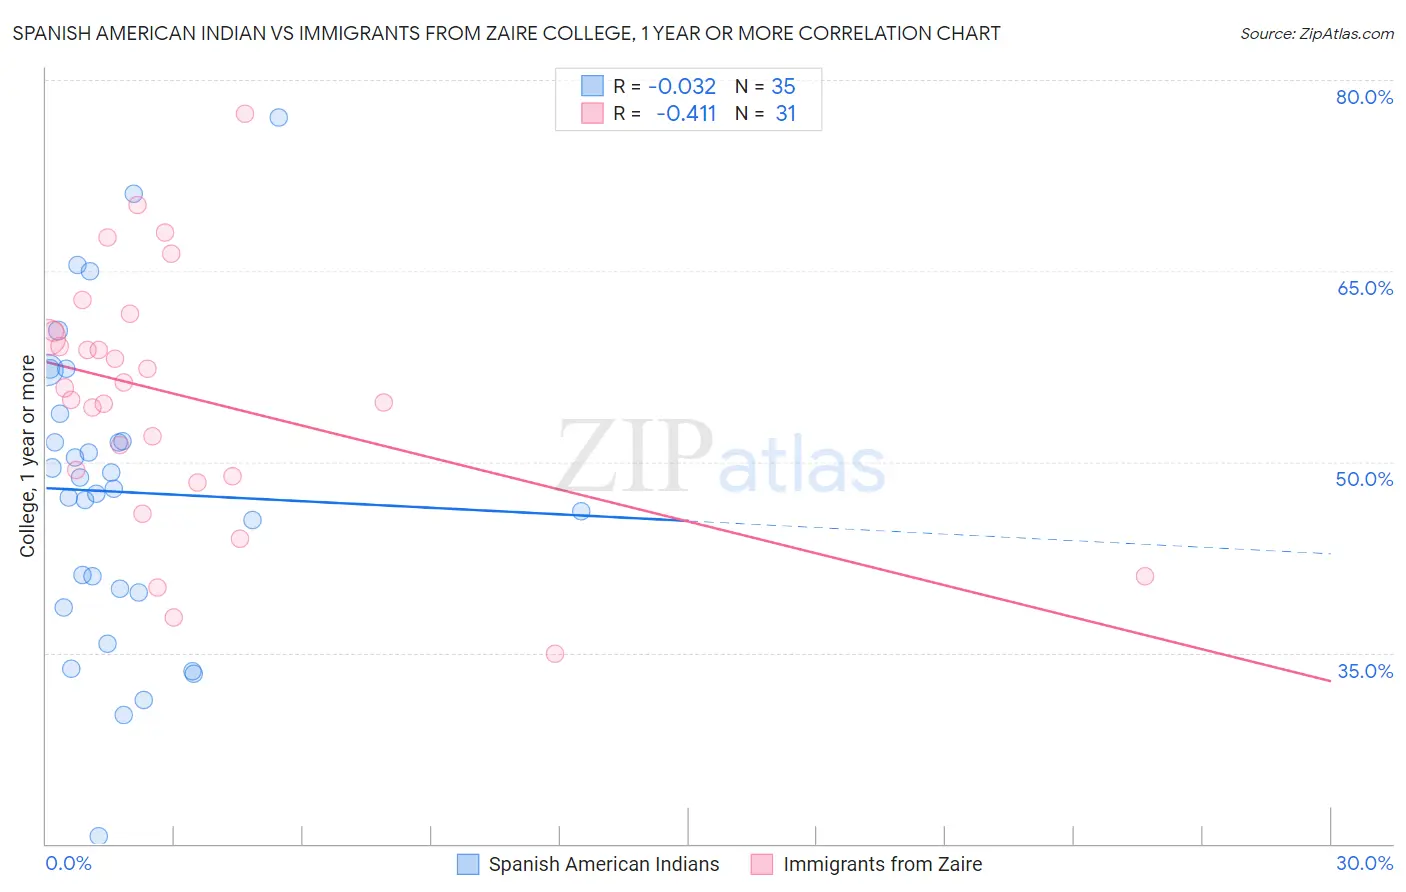
Spanish American Indian vs Immigrants from Zaire College, 1 year or more Correlation Chart
The statistical analysis conducted on geographies consisting of 73,150,359 people shows no correlation between the proportion of Spanish American Indians and percentage of population with at least college, 1 year or more education in the United States with a correlation coefficient (R) of -0.032 and weighted average of 48.5%. Similarly, the statistical analysis conducted on geographies consisting of 107,255,700 people shows a moderate negative correlation between the proportion of Immigrants from Zaire and percentage of population with at least college, 1 year or more education in the United States with a correlation coefficient (R) of -0.411 and weighted average of 58.3%, a difference of 20.1%.
College, 1 year or more Correlation Summary
| Measurement | Spanish American Indian | Immigrants from Zaire |
| Minimum | 20.6% | 35.0% |
| Maximum | 77.0% | 77.4% |
| Range | 56.4% | 42.4% |
| Mean | 47.6% | 55.2% |
| Median | 47.8% | 55.8% |
| Interquartile 25% (IQ1) | 39.7% | 48.9% |
| Interquartile 75% (IQ3) | 53.8% | 60.2% |
| Interquartile Range (IQR) | 14.1% | 11.3% |
| Standard Deviation (Sample) | 12.0% | 9.8% |
| Standard Deviation (Population) | 11.8% | 9.6% |
Similar Demographics by College, 1 year or more
Demographics Similar to Spanish American Indians by College, 1 year or more
In terms of college, 1 year or more, the demographic groups most similar to Spanish American Indians are Pennsylvania German (48.5%, a difference of 0.010%), Immigrants from Central America (48.5%, a difference of 0.060%), Immigrants from the Azores (48.4%, a difference of 0.32%), Yuman (48.7%, a difference of 0.44%), and Lumbee (48.9%, a difference of 0.72%).
| Demographics | Rating | Rank | College, 1 year or more |
| Cape Verdeans | 0.0 /100 | #329 | Tragic 50.3% |
| Natives/Alaskans | 0.0 /100 | #330 | Tragic 50.2% |
| Immigrants | Yemen | 0.0 /100 | #331 | Tragic 50.0% |
| Mexicans | 0.0 /100 | #332 | Tragic 49.2% |
| Immigrants | Dominican Republic | 0.0 /100 | #333 | Tragic 49.1% |
| Lumbee | 0.0 /100 | #334 | Tragic 48.9% |
| Yuman | 0.0 /100 | #335 | Tragic 48.7% |
| Spanish American Indians | 0.0 /100 | #336 | Tragic 48.5% |
| Pennsylvania Germans | 0.0 /100 | #337 | Tragic 48.5% |
| Immigrants | Central America | 0.0 /100 | #338 | Tragic 48.5% |
| Immigrants | Azores | 0.0 /100 | #339 | Tragic 48.4% |
| Immigrants | Cabo Verde | 0.0 /100 | #340 | Tragic 48.1% |
| Immigrants | Mexico | 0.0 /100 | #341 | Tragic 47.5% |
| Inupiat | 0.0 /100 | #342 | Tragic 47.2% |
| Tohono O'odham | 0.0 /100 | #343 | Tragic 47.1% |
Demographics Similar to Immigrants from Zaire by College, 1 year or more
In terms of college, 1 year or more, the demographic groups most similar to Immigrants from Zaire are Immigrants from Vietnam (58.2%, a difference of 0.040%), Panamanian (58.3%, a difference of 0.050%), Senegalese (58.2%, a difference of 0.16%), Ghanaian (58.4%, a difference of 0.19%), and Immigrants from South America (58.4%, a difference of 0.27%).
| Demographics | Rating | Rank | College, 1 year or more |
| Immigrants | South Eastern Asia | 25.1 /100 | #198 | Fair 58.5% |
| Slovaks | 24.6 /100 | #199 | Fair 58.5% |
| Spanish | 24.2 /100 | #200 | Fair 58.5% |
| Nigerians | 23.0 /100 | #201 | Fair 58.5% |
| Immigrants | South America | 21.9 /100 | #202 | Fair 58.4% |
| Ghanaians | 20.9 /100 | #203 | Fair 58.4% |
| Panamanians | 19.2 /100 | #204 | Poor 58.3% |
| Immigrants | Zaire | 18.7 /100 | #205 | Poor 58.3% |
| Immigrants | Vietnam | 18.2 /100 | #206 | Poor 58.2% |
| Senegalese | 16.9 /100 | #207 | Poor 58.2% |
| Immigrants | Uruguay | 15.2 /100 | #208 | Poor 58.1% |
| Immigrants | Middle Africa | 14.0 /100 | #209 | Poor 58.0% |
| Tsimshian | 13.5 /100 | #210 | Poor 57.9% |
| Immigrants | Nigeria | 13.3 /100 | #211 | Poor 57.9% |
| Immigrants | Senegal | 11.8 /100 | #212 | Poor 57.8% |