Spanish American Indian vs Immigrants from Burma/Myanmar No Schooling Completed
COMPARE
Spanish American Indian
Immigrants from Burma/Myanmar
No Schooling Completed
No Schooling Completed Comparison
Spanish American Indians
Immigrants from Burma/Myanmar
4.2%
NO SCHOOLING COMPLETED
0.0/ 100
METRIC RATING
347th/ 347
METRIC RANK
3.1%
NO SCHOOLING COMPLETED
0.0/ 100
METRIC RATING
319th/ 347
METRIC RANK
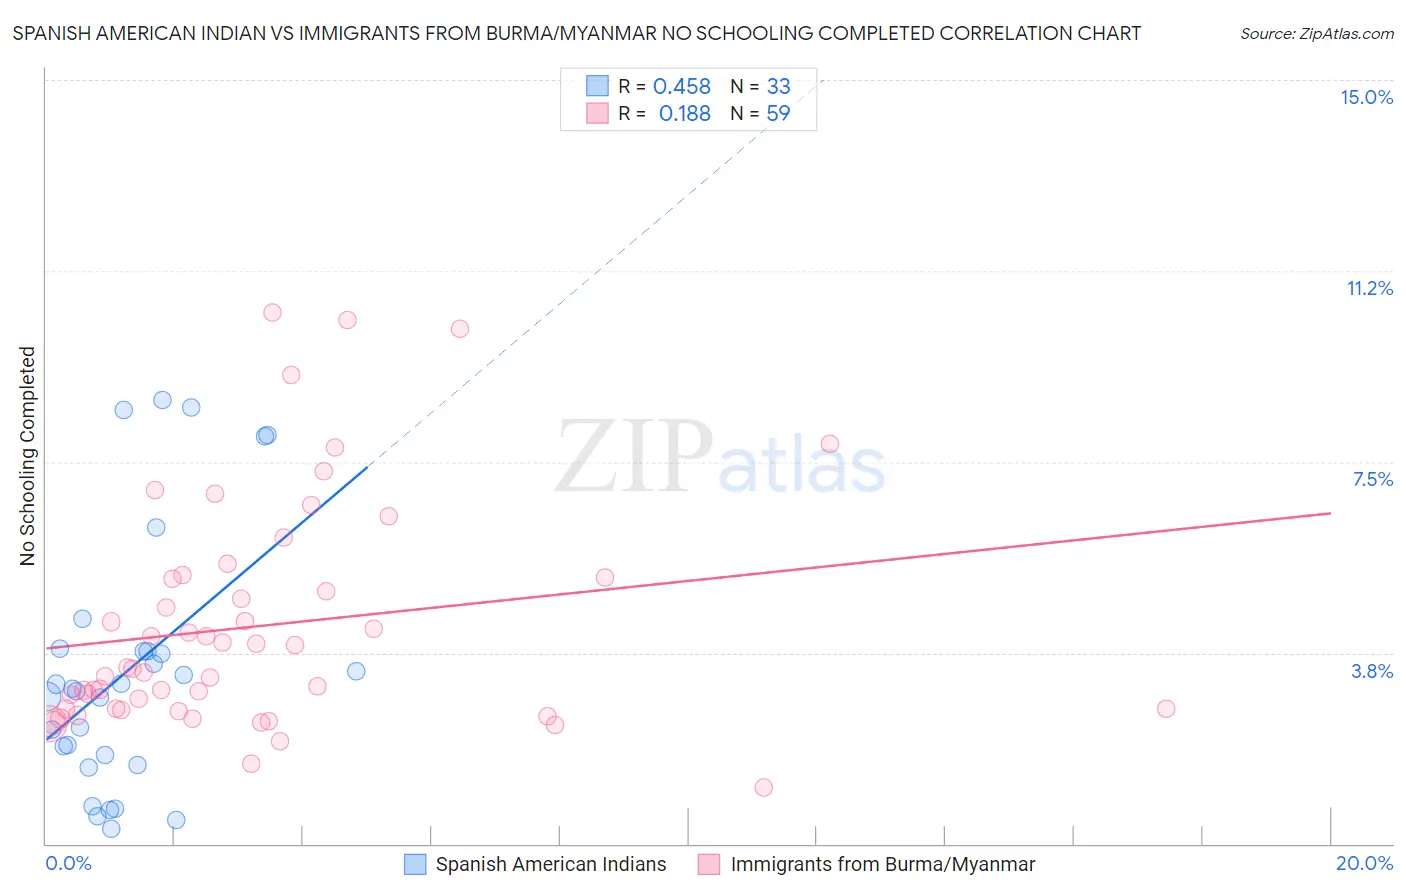
Spanish American Indian vs Immigrants from Burma/Myanmar No Schooling Completed Correlation Chart
The statistical analysis conducted on geographies consisting of 73,096,872 people shows a moderate positive correlation between the proportion of Spanish American Indians and percentage of population with no schooling in the United States with a correlation coefficient (R) of 0.458 and weighted average of 4.2%. Similarly, the statistical analysis conducted on geographies consisting of 171,802,703 people shows a poor positive correlation between the proportion of Immigrants from Burma/Myanmar and percentage of population with no schooling in the United States with a correlation coefficient (R) of 0.188 and weighted average of 3.1%, a difference of 33.3%.
No Schooling Completed Correlation Summary
| Measurement | Spanish American Indian | Immigrants from Burma/Myanmar |
| Minimum | 0.30% | 1.1% |
| Maximum | 8.7% | 10.4% |
| Range | 8.4% | 9.3% |
| Mean | 3.4% | 4.3% |
| Median | 3.1% | 3.4% |
| Interquartile 25% (IQ1) | 1.6% | 2.6% |
| Interquartile 75% (IQ3) | 3.8% | 5.2% |
| Interquartile Range (IQR) | 2.2% | 2.6% |
| Standard Deviation (Sample) | 2.5% | 2.2% |
| Standard Deviation (Population) | 2.5% | 2.2% |
Similar Demographics by No Schooling Completed
Demographics Similar to Spanish American Indians by No Schooling Completed
In terms of no schooling completed, the demographic groups most similar to Spanish American Indians are Immigrants from Yemen (4.1%, a difference of 1.5%), Immigrants from El Salvador (3.9%, a difference of 8.1%), Nepalese (3.8%, a difference of 10.1%), Salvadoran (3.7%, a difference of 11.9%), and Immigrants from Mexico (3.6%, a difference of 15.0%).
| Demographics | Rating | Rank | No Schooling Completed |
| Immigrants | Dominican Republic | 0.0 /100 | #333 | Tragic 3.4% |
| Guatemalans | 0.0 /100 | #334 | Tragic 3.5% |
| Immigrants | Cambodia | 0.0 /100 | #335 | Tragic 3.5% |
| Immigrants | Fiji | 0.0 /100 | #336 | Tragic 3.5% |
| Immigrants | Cabo Verde | 0.0 /100 | #337 | Tragic 3.5% |
| Bangladeshis | 0.0 /100 | #338 | Tragic 3.5% |
| Yakama | 0.0 /100 | #339 | Tragic 3.6% |
| Immigrants | Guatemala | 0.0 /100 | #340 | Tragic 3.6% |
| Immigrants | Central America | 0.0 /100 | #341 | Tragic 3.6% |
| Immigrants | Mexico | 0.0 /100 | #342 | Tragic 3.6% |
| Salvadorans | 0.0 /100 | #343 | Tragic 3.7% |
| Nepalese | 0.0 /100 | #344 | Tragic 3.8% |
| Immigrants | El Salvador | 0.0 /100 | #345 | Tragic 3.9% |
| Immigrants | Yemen | 0.0 /100 | #346 | Tragic 4.1% |
| Spanish American Indians | 0.0 /100 | #347 | Tragic 4.2% |
Demographics Similar to Immigrants from Burma/Myanmar by No Schooling Completed
In terms of no schooling completed, the demographic groups most similar to Immigrants from Burma/Myanmar are Immigrants from Bangladesh (3.1%, a difference of 0.040%), Immigrants from Laos (3.1%, a difference of 0.15%), Immigrants from Guyana (3.1%, a difference of 0.74%), Immigrants from Honduras (3.2%, a difference of 0.83%), and Vietnamese (3.2%, a difference of 1.0%).
| Demographics | Rating | Rank | No Schooling Completed |
| Sri Lankans | 0.0 /100 | #312 | Tragic 3.0% |
| Hondurans | 0.0 /100 | #313 | Tragic 3.1% |
| Immigrants | Belize | 0.0 /100 | #314 | Tragic 3.1% |
| Immigrants | Nicaragua | 0.0 /100 | #315 | Tragic 3.1% |
| Immigrants | Ecuador | 0.0 /100 | #316 | Tragic 3.1% |
| Cape Verdeans | 0.0 /100 | #317 | Tragic 3.1% |
| Immigrants | Guyana | 0.0 /100 | #318 | Tragic 3.1% |
| Immigrants | Burma/Myanmar | 0.0 /100 | #319 | Tragic 3.1% |
| Immigrants | Bangladesh | 0.0 /100 | #320 | Tragic 3.1% |
| Immigrants | Laos | 0.0 /100 | #321 | Tragic 3.1% |
| Immigrants | Honduras | 0.0 /100 | #322 | Tragic 3.2% |
| Vietnamese | 0.0 /100 | #323 | Tragic 3.2% |
| Mexican American Indians | 0.0 /100 | #324 | Tragic 3.2% |
| Dominicans | 0.0 /100 | #325 | Tragic 3.2% |
| Indonesians | 0.0 /100 | #326 | Tragic 3.2% |