Spanish American Indian vs Immigrants from Belarus Unemployment Among Women with Children Under 18 years
COMPARE
Spanish American Indian
Immigrants from Belarus
Unemployment Among Women with Children Under 18 years
Unemployment Among Women with Children Under 18 years Comparison
Spanish American Indians
Immigrants from Belarus
6.1%
UNEMPLOYMENT AMONG WOMEN WITH CHILDREN UNDER 18 YEARS
0.1/ 100
METRIC RATING
263rd/ 347
METRIC RANK
5.3%
UNEMPLOYMENT AMONG WOMEN WITH CHILDREN UNDER 18 YEARS
73.4/ 100
METRIC RATING
146th/ 347
METRIC RANK
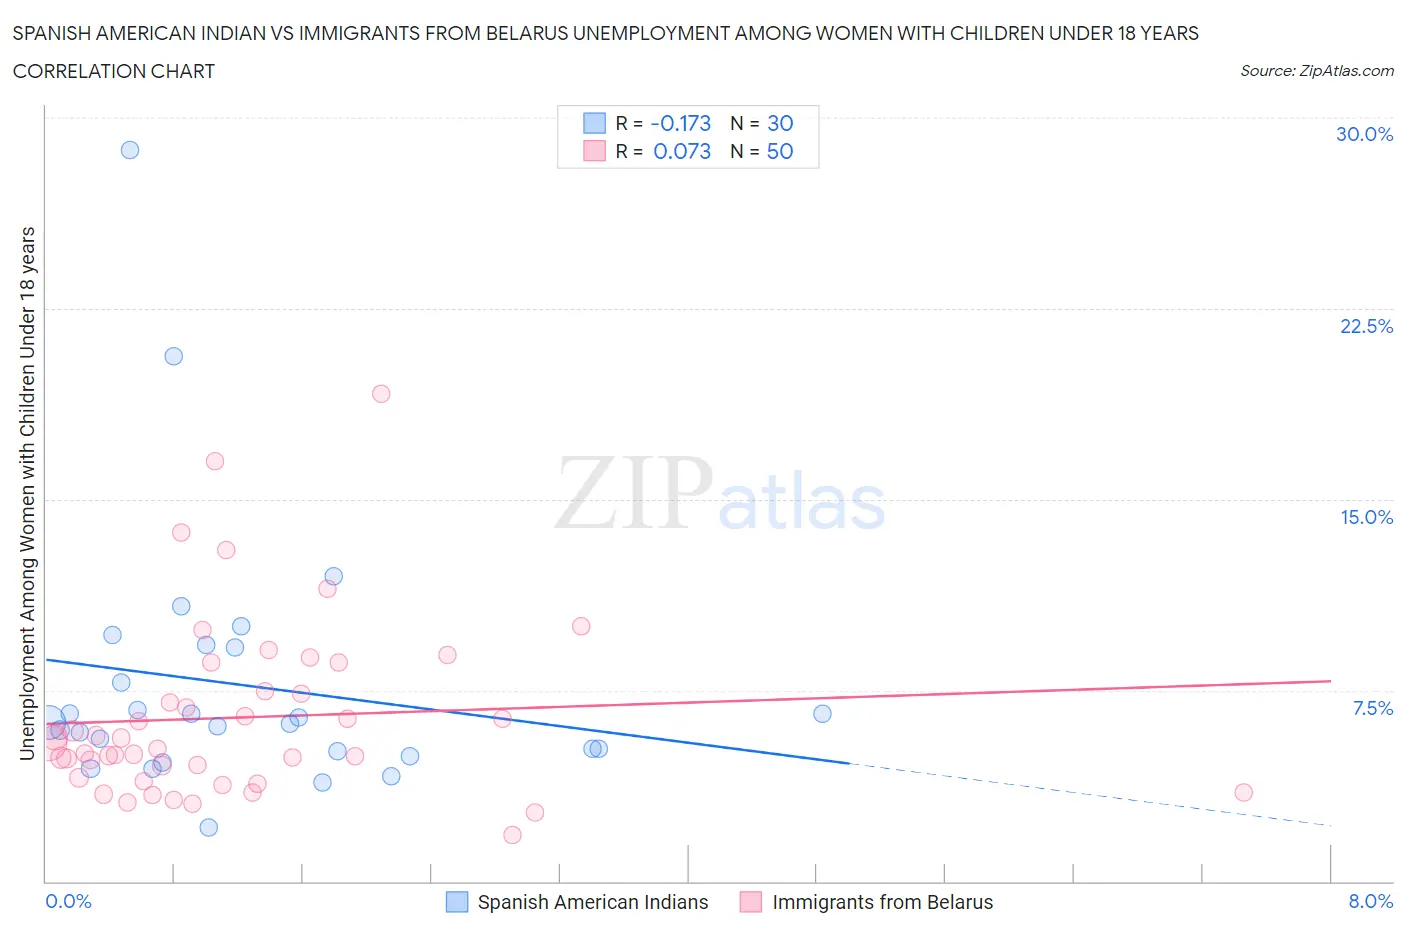
Spanish American Indian vs Immigrants from Belarus Unemployment Among Women with Children Under 18 years Correlation Chart
The statistical analysis conducted on geographies consisting of 72,726,948 people shows a poor negative correlation between the proportion of Spanish American Indians and unemployment rate among women with children under the age of 18 in the United States with a correlation coefficient (R) of -0.173 and weighted average of 6.1%. Similarly, the statistical analysis conducted on geographies consisting of 147,822,685 people shows a slight positive correlation between the proportion of Immigrants from Belarus and unemployment rate among women with children under the age of 18 in the United States with a correlation coefficient (R) of 0.073 and weighted average of 5.3%, a difference of 14.7%.
Unemployment Among Women with Children Under 18 years Correlation Summary
| Measurement | Spanish American Indian | Immigrants from Belarus |
| Minimum | 2.1% | 1.8% |
| Maximum | 28.7% | 19.2% |
| Range | 26.6% | 17.4% |
| Mean | 7.7% | 6.4% |
| Median | 6.2% | 5.3% |
| Interquartile 25% (IQ1) | 5.1% | 4.1% |
| Interquartile 75% (IQ3) | 9.2% | 7.5% |
| Interquartile Range (IQR) | 4.1% | 3.4% |
| Standard Deviation (Sample) | 5.2% | 3.5% |
| Standard Deviation (Population) | 5.1% | 3.5% |
Similar Demographics by Unemployment Among Women with Children Under 18 years
Demographics Similar to Spanish American Indians by Unemployment Among Women with Children Under 18 years
In terms of unemployment among women with children under 18 years, the demographic groups most similar to Spanish American Indians are Immigrants from Liberia (6.1%, a difference of 0.020%), Immigrants from Trinidad and Tobago (6.1%, a difference of 0.020%), Comanche (6.1%, a difference of 0.070%), Nigerian (6.1%, a difference of 0.12%), and Ottawa (6.1%, a difference of 0.14%).
| Demographics | Rating | Rank | Unemployment Among Women with Children Under 18 years |
| Nepalese | 0.2 /100 | #256 | Tragic 6.0% |
| Bermudans | 0.1 /100 | #257 | Tragic 6.1% |
| Immigrants | Nigeria | 0.1 /100 | #258 | Tragic 6.1% |
| Ottawa | 0.1 /100 | #259 | Tragic 6.1% |
| Nigerians | 0.1 /100 | #260 | Tragic 6.1% |
| Immigrants | Liberia | 0.1 /100 | #261 | Tragic 6.1% |
| Immigrants | Trinidad and Tobago | 0.1 /100 | #262 | Tragic 6.1% |
| Spanish American Indians | 0.1 /100 | #263 | Tragic 6.1% |
| Comanche | 0.1 /100 | #264 | Tragic 6.1% |
| Immigrants | Bahamas | 0.1 /100 | #265 | Tragic 6.1% |
| Sub-Saharan Africans | 0.1 /100 | #266 | Tragic 6.2% |
| French American Indians | 0.1 /100 | #267 | Tragic 6.2% |
| Trinidadians and Tobagonians | 0.1 /100 | #268 | Tragic 6.2% |
| Cajuns | 0.1 /100 | #269 | Tragic 6.2% |
| Ghanaians | 0.1 /100 | #270 | Tragic 6.2% |
Demographics Similar to Immigrants from Belarus by Unemployment Among Women with Children Under 18 years
In terms of unemployment among women with children under 18 years, the demographic groups most similar to Immigrants from Belarus are Bangladeshi (5.3%, a difference of 0.020%), Immigrants from Western Europe (5.4%, a difference of 0.050%), Immigrants from Egypt (5.3%, a difference of 0.060%), Immigrants from Kenya (5.4%, a difference of 0.11%), and Immigrants from England (5.3%, a difference of 0.14%).
| Demographics | Rating | Rank | Unemployment Among Women with Children Under 18 years |
| Immigrants | Ukraine | 78.5 /100 | #139 | Good 5.3% |
| Immigrants | Norway | 76.2 /100 | #140 | Good 5.3% |
| Venezuelans | 76.0 /100 | #141 | Good 5.3% |
| Immigrants | Venezuela | 75.4 /100 | #142 | Good 5.3% |
| Chileans | 75.0 /100 | #143 | Good 5.3% |
| Immigrants | England | 74.9 /100 | #144 | Good 5.3% |
| Immigrants | Egypt | 74.0 /100 | #145 | Good 5.3% |
| Immigrants | Belarus | 73.4 /100 | #146 | Good 5.3% |
| Bangladeshis | 73.2 /100 | #147 | Good 5.3% |
| Immigrants | Western Europe | 72.8 /100 | #148 | Good 5.4% |
| Immigrants | Kenya | 72.2 /100 | #149 | Good 5.4% |
| Immigrants | Argentina | 71.7 /100 | #150 | Good 5.4% |
| Immigrants | Iran | 71.1 /100 | #151 | Good 5.4% |
| Immigrants | South Eastern Asia | 71.1 /100 | #152 | Good 5.4% |
| Carpatho Rusyns | 70.8 /100 | #153 | Good 5.4% |