Spaniard vs Central American 9th Grade
COMPARE
Spaniard
Central American
9th Grade
9th Grade Comparison
Spaniards
Central Americans
94.9%
9TH GRADE
59.6/ 100
METRIC RATING
169th/ 347
METRIC RANK
90.4%
9TH GRADE
0.0/ 100
METRIC RATING
338th/ 347
METRIC RANK
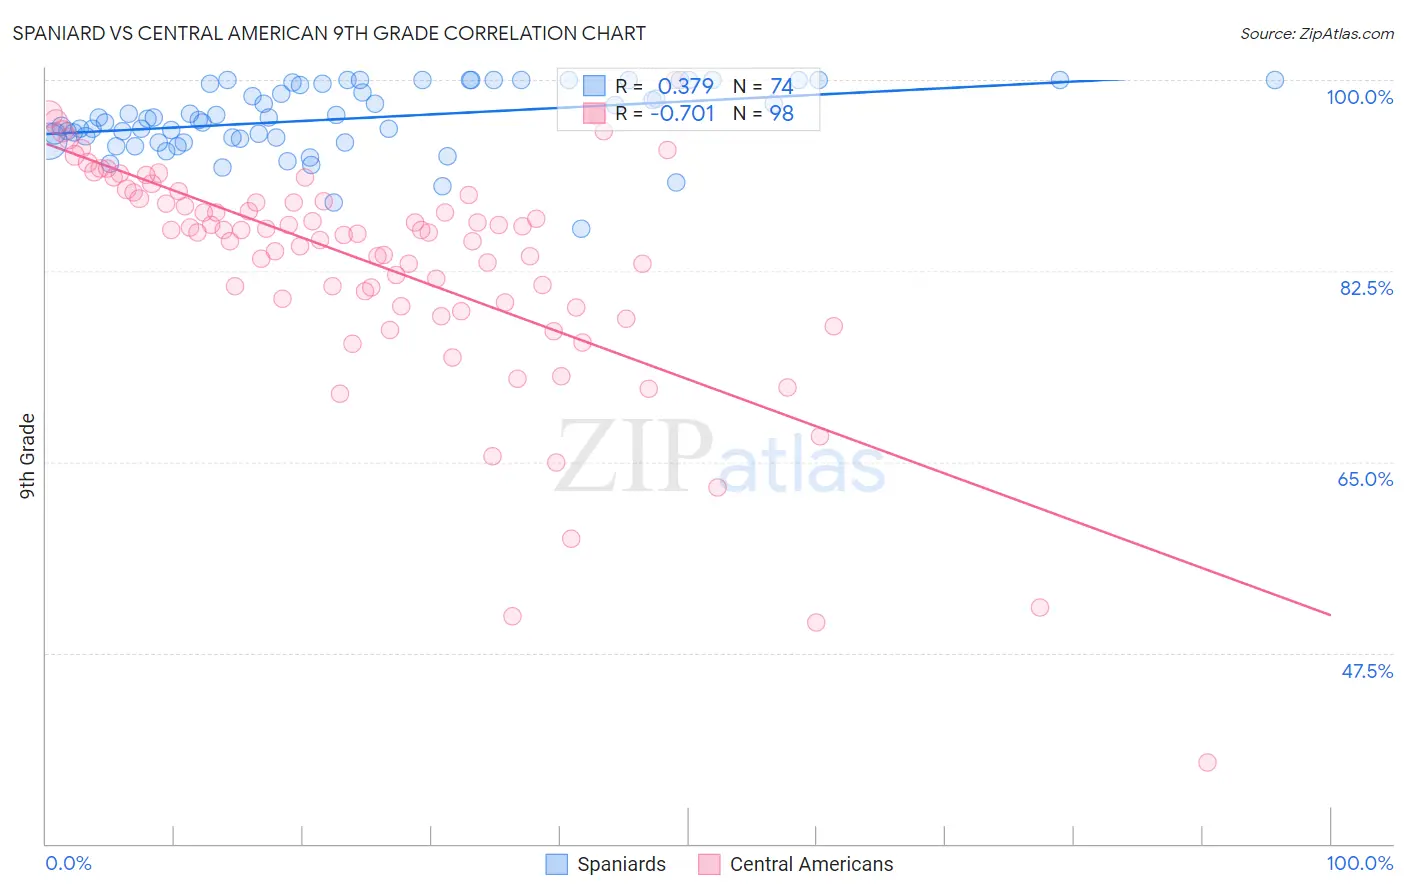
Spaniard vs Central American 9th Grade Correlation Chart
The statistical analysis conducted on geographies consisting of 443,543,963 people shows a mild positive correlation between the proportion of Spaniards and percentage of population with at least 9th grade education in the United States with a correlation coefficient (R) of 0.379 and weighted average of 94.9%. Similarly, the statistical analysis conducted on geographies consisting of 504,619,198 people shows a strong negative correlation between the proportion of Central Americans and percentage of population with at least 9th grade education in the United States with a correlation coefficient (R) of -0.701 and weighted average of 90.4%, a difference of 5.1%.
9th Grade Correlation Summary
| Measurement | Spaniard | Central American |
| Minimum | 86.4% | 37.5% |
| Maximum | 100.0% | 100.0% |
| Range | 13.6% | 62.5% |
| Mean | 96.4% | 82.9% |
| Median | 96.5% | 86.0% |
| Interquartile 25% (IQ1) | 94.6% | 79.3% |
| Interquartile 75% (IQ3) | 99.6% | 89.2% |
| Interquartile Range (IQR) | 5.0% | 9.9% |
| Standard Deviation (Sample) | 3.1% | 10.7% |
| Standard Deviation (Population) | 3.0% | 10.7% |
Similar Demographics by 9th Grade
Demographics Similar to Spaniards by 9th Grade
In terms of 9th grade, the demographic groups most similar to Spaniards are Immigrants from Brazil (95.0%, a difference of 0.010%), Chilean (95.0%, a difference of 0.010%), Alsatian (94.9%, a difference of 0.010%), Colville (94.9%, a difference of 0.010%), and Blackfeet (95.0%, a difference of 0.020%).
| Demographics | Rating | Rank | 9th Grade |
| Bermudans | 65.8 /100 | #162 | Good 95.0% |
| Pakistanis | 64.1 /100 | #163 | Good 95.0% |
| Venezuelans | 63.6 /100 | #164 | Good 95.0% |
| Blackfeet | 62.6 /100 | #165 | Good 95.0% |
| Ute | 62.6 /100 | #166 | Good 95.0% |
| Immigrants | Brazil | 61.1 /100 | #167 | Good 95.0% |
| Chileans | 60.7 /100 | #168 | Good 95.0% |
| Spaniards | 59.6 /100 | #169 | Average 94.9% |
| Alsatians | 58.6 /100 | #170 | Average 94.9% |
| Colville | 58.5 /100 | #171 | Average 94.9% |
| Iraqis | 54.0 /100 | #172 | Average 94.9% |
| Cheyenne | 51.5 /100 | #173 | Average 94.9% |
| Immigrants | Egypt | 50.0 /100 | #174 | Average 94.9% |
| Brazilians | 49.8 /100 | #175 | Average 94.9% |
| Immigrants | Spain | 49.1 /100 | #176 | Average 94.9% |
Demographics Similar to Central Americans by 9th Grade
In terms of 9th grade, the demographic groups most similar to Central Americans are Immigrants from Latin America (90.4%, a difference of 0.010%), Immigrants from Dominican Republic (90.5%, a difference of 0.13%), Immigrants from Honduras (90.6%, a difference of 0.26%), Yakama (90.1%, a difference of 0.34%), and Mexican (90.0%, a difference of 0.40%).
| Demographics | Rating | Rank | 9th Grade |
| Mexican American Indians | 0.0 /100 | #331 | Tragic 90.9% |
| Hispanics or Latinos | 0.0 /100 | #332 | Tragic 90.9% |
| Immigrants | Yemen | 0.0 /100 | #333 | Tragic 90.8% |
| Immigrants | Azores | 0.0 /100 | #334 | Tragic 90.8% |
| Immigrants | Honduras | 0.0 /100 | #335 | Tragic 90.6% |
| Immigrants | Dominican Republic | 0.0 /100 | #336 | Tragic 90.5% |
| Immigrants | Latin America | 0.0 /100 | #337 | Tragic 90.4% |
| Central Americans | 0.0 /100 | #338 | Tragic 90.4% |
| Yakama | 0.0 /100 | #339 | Tragic 90.1% |
| Mexicans | 0.0 /100 | #340 | Tragic 90.0% |
| Guatemalans | 0.0 /100 | #341 | Tragic 89.9% |
| Salvadorans | 0.0 /100 | #342 | Tragic 89.6% |
| Immigrants | Guatemala | 0.0 /100 | #343 | Tragic 89.4% |
| Immigrants | El Salvador | 0.0 /100 | #344 | Tragic 89.0% |
| Immigrants | Central America | 0.0 /100 | #345 | Tragic 89.0% |