Spaniard vs Native Hawaiian 9th Grade
COMPARE
Spaniard
Native Hawaiian
9th Grade
9th Grade Comparison
Spaniards
Native Hawaiians
94.9%
9TH GRADE
59.6/ 100
METRIC RATING
169th/ 347
METRIC RANK
95.9%
9TH GRADE
99.8/ 100
METRIC RATING
60th/ 347
METRIC RANK
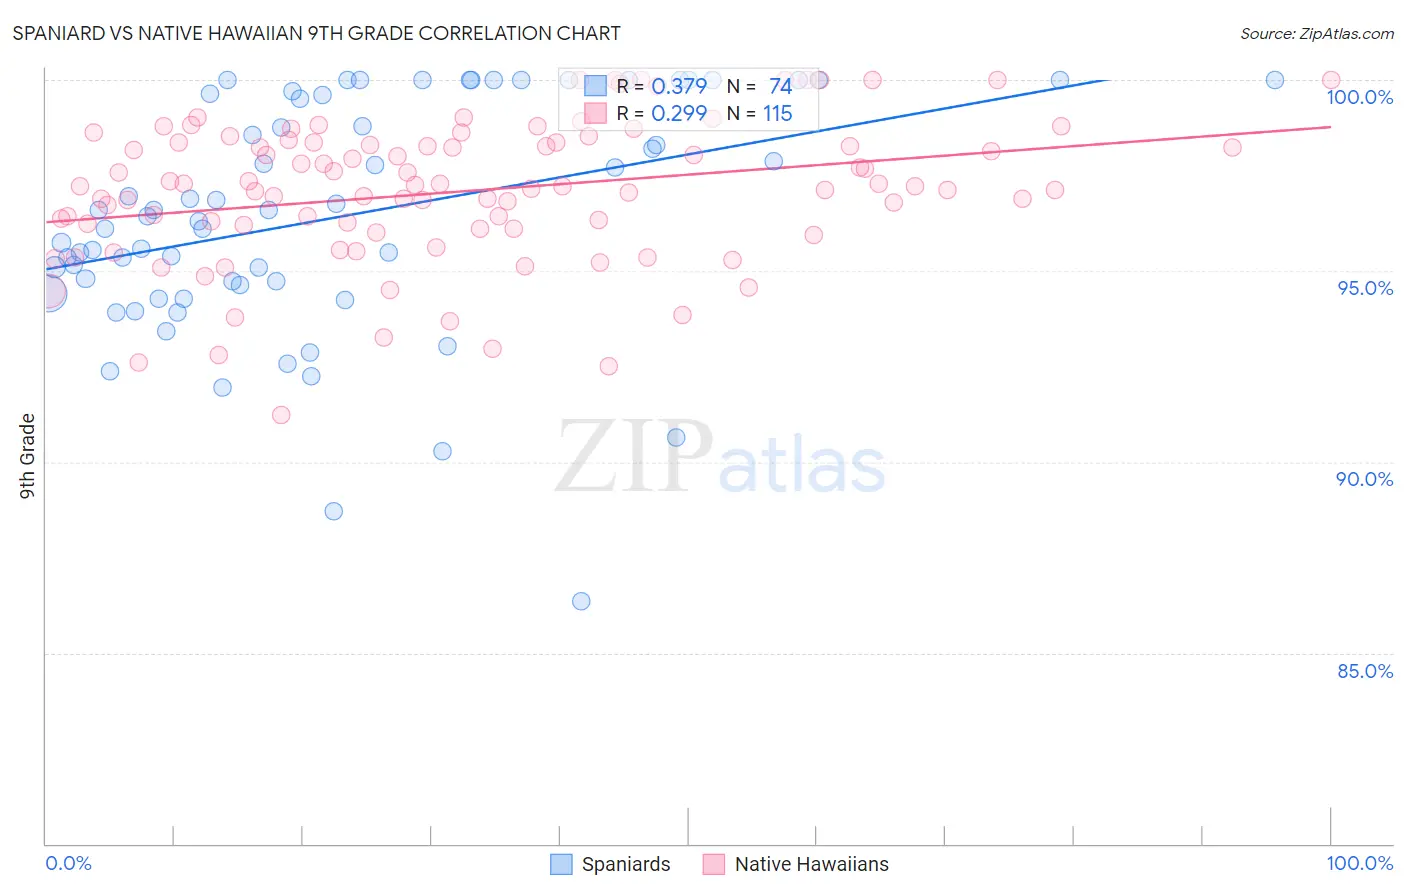
Spaniard vs Native Hawaiian 9th Grade Correlation Chart
The statistical analysis conducted on geographies consisting of 443,543,963 people shows a mild positive correlation between the proportion of Spaniards and percentage of population with at least 9th grade education in the United States with a correlation coefficient (R) of 0.379 and weighted average of 94.9%. Similarly, the statistical analysis conducted on geographies consisting of 332,106,425 people shows a weak positive correlation between the proportion of Native Hawaiians and percentage of population with at least 9th grade education in the United States with a correlation coefficient (R) of 0.299 and weighted average of 95.9%, a difference of 1.0%.
9th Grade Correlation Summary
| Measurement | Spaniard | Native Hawaiian |
| Minimum | 86.4% | 91.2% |
| Maximum | 100.0% | 100.0% |
| Range | 13.6% | 8.8% |
| Mean | 96.4% | 97.1% |
| Median | 96.5% | 97.2% |
| Interquartile 25% (IQ1) | 94.6% | 96.1% |
| Interquartile 75% (IQ3) | 99.6% | 98.4% |
| Interquartile Range (IQR) | 5.0% | 2.2% |
| Standard Deviation (Sample) | 3.1% | 1.9% |
| Standard Deviation (Population) | 3.0% | 1.8% |
Similar Demographics by 9th Grade
Demographics Similar to Spaniards by 9th Grade
In terms of 9th grade, the demographic groups most similar to Spaniards are Immigrants from Brazil (95.0%, a difference of 0.010%), Chilean (95.0%, a difference of 0.010%), Alsatian (94.9%, a difference of 0.010%), Colville (94.9%, a difference of 0.010%), and Blackfeet (95.0%, a difference of 0.020%).
| Demographics | Rating | Rank | 9th Grade |
| Bermudans | 65.8 /100 | #162 | Good 95.0% |
| Pakistanis | 64.1 /100 | #163 | Good 95.0% |
| Venezuelans | 63.6 /100 | #164 | Good 95.0% |
| Blackfeet | 62.6 /100 | #165 | Good 95.0% |
| Ute | 62.6 /100 | #166 | Good 95.0% |
| Immigrants | Brazil | 61.1 /100 | #167 | Good 95.0% |
| Chileans | 60.7 /100 | #168 | Good 95.0% |
| Spaniards | 59.6 /100 | #169 | Average 94.9% |
| Alsatians | 58.6 /100 | #170 | Average 94.9% |
| Colville | 58.5 /100 | #171 | Average 94.9% |
| Iraqis | 54.0 /100 | #172 | Average 94.9% |
| Cheyenne | 51.5 /100 | #173 | Average 94.9% |
| Immigrants | Egypt | 50.0 /100 | #174 | Average 94.9% |
| Brazilians | 49.8 /100 | #175 | Average 94.9% |
| Immigrants | Spain | 49.1 /100 | #176 | Average 94.9% |
Demographics Similar to Native Hawaiians by 9th Grade
In terms of 9th grade, the demographic groups most similar to Native Hawaiians are Sioux (95.9%, a difference of 0.010%), New Zealander (95.9%, a difference of 0.020%), Ukrainian (95.9%, a difference of 0.020%), Macedonian (96.0%, a difference of 0.030%), and Aleut (96.0%, a difference of 0.030%).
| Demographics | Rating | Rank | 9th Grade |
| Austrians | 99.8 /100 | #53 | Exceptional 96.0% |
| Immigrants | Canada | 99.8 /100 | #54 | Exceptional 96.0% |
| Immigrants | Austria | 99.8 /100 | #55 | Exceptional 96.0% |
| Immigrants | North America | 99.8 /100 | #56 | Exceptional 96.0% |
| Macedonians | 99.8 /100 | #57 | Exceptional 96.0% |
| Aleuts | 99.8 /100 | #58 | Exceptional 96.0% |
| New Zealanders | 99.8 /100 | #59 | Exceptional 95.9% |
| Native Hawaiians | 99.8 /100 | #60 | Exceptional 95.9% |
| Sioux | 99.8 /100 | #61 | Exceptional 95.9% |
| Ukrainians | 99.7 /100 | #62 | Exceptional 95.9% |
| Canadians | 99.7 /100 | #63 | Exceptional 95.9% |
| Zimbabweans | 99.7 /100 | #64 | Exceptional 95.9% |
| Immigrants | England | 99.6 /100 | #65 | Exceptional 95.9% |
| Immigrants | Netherlands | 99.6 /100 | #66 | Exceptional 95.8% |
| Cypriots | 99.6 /100 | #67 | Exceptional 95.8% |