Spaniard vs Immigrants from South Central Asia Householder Income Ages 25 - 44 years
COMPARE
Spaniard
Immigrants from South Central Asia
Householder Income Ages 25 - 44 years
Householder Income Ages 25 - 44 years Comparison
Spaniards
Immigrants from South Central Asia
$93,366
HOUSEHOLDER INCOME AGES 25 - 44 YEARS
34.0/ 100
METRIC RATING
187th/ 347
METRIC RANK
$116,626
HOUSEHOLDER INCOME AGES 25 - 44 YEARS
100.0/ 100
METRIC RATING
15th/ 347
METRIC RANK
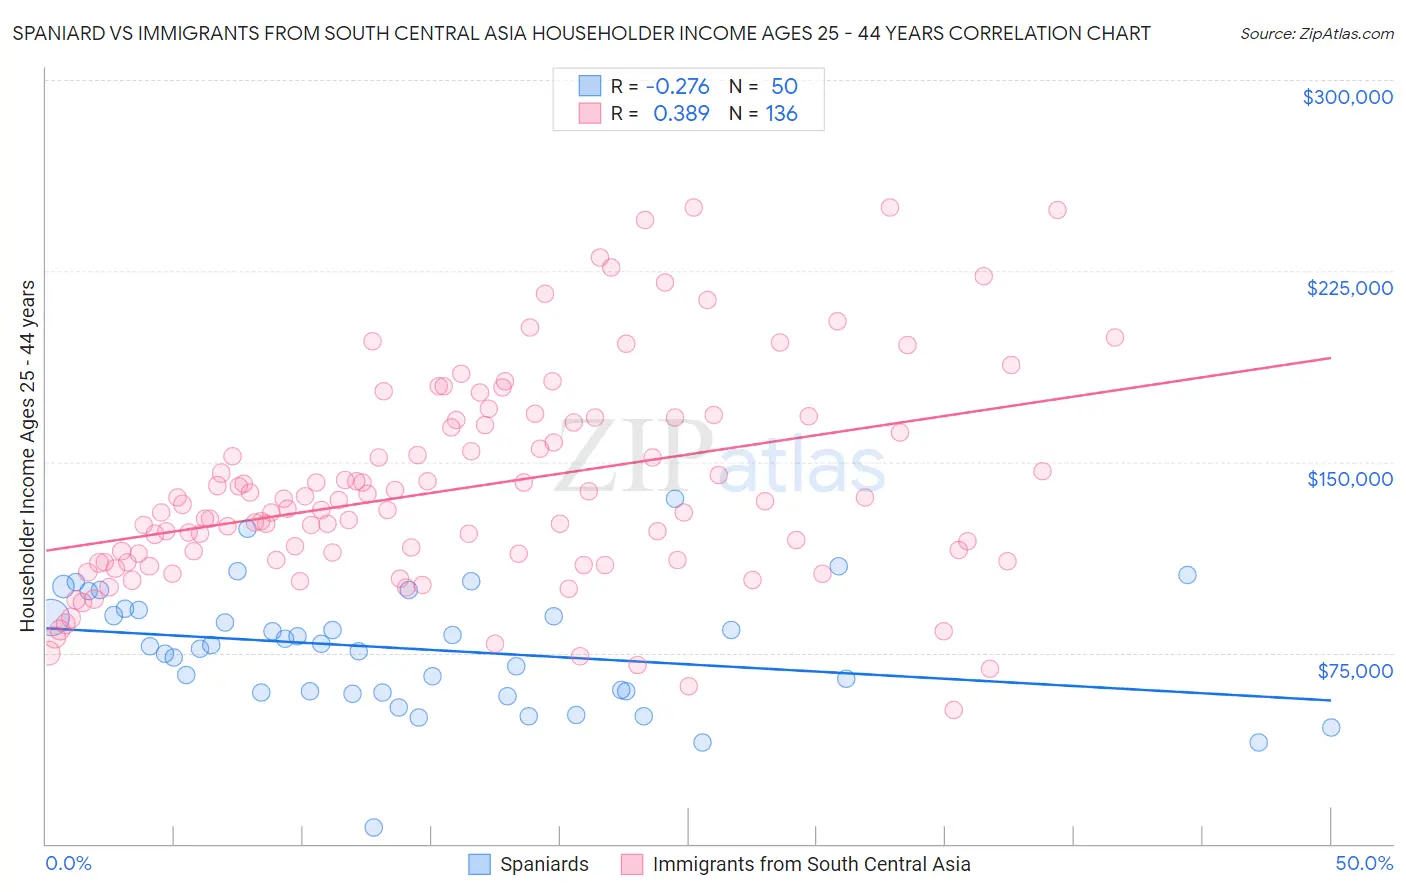
Spaniard vs Immigrants from South Central Asia Householder Income Ages 25 - 44 years Correlation Chart
The statistical analysis conducted on geographies consisting of 441,839,666 people shows a weak negative correlation between the proportion of Spaniards and household income with householder between the ages 25 and 44 in the United States with a correlation coefficient (R) of -0.276 and weighted average of $93,366. Similarly, the statistical analysis conducted on geographies consisting of 471,423,947 people shows a mild positive correlation between the proportion of Immigrants from South Central Asia and household income with householder between the ages 25 and 44 in the United States with a correlation coefficient (R) of 0.389 and weighted average of $116,626, a difference of 24.9%.
Householder Income Ages 25 - 44 years Correlation Summary
| Measurement | Spaniard | Immigrants from South Central Asia |
| Minimum | $6,532 | $52,604 |
| Maximum | $135,588 | $250,001 |
| Range | $129,056 | $197,397 |
| Mean | $76,452 | $139,407 |
| Median | $77,939 | $131,527 |
| Interquartile 25% (IQ1) | $59,278 | $111,176 |
| Interquartile 75% (IQ3) | $91,655 | $164,920 |
| Interquartile Range (IQR) | $32,377 | $53,743 |
| Standard Deviation (Sample) | $23,796 | $41,092 |
| Standard Deviation (Population) | $23,557 | $40,940 |
Similar Demographics by Householder Income Ages 25 - 44 years
Demographics Similar to Spaniards by Householder Income Ages 25 - 44 years
In terms of householder income ages 25 - 44 years, the demographic groups most similar to Spaniards are Sierra Leonean ($93,435, a difference of 0.070%), Immigrants from Eritrea ($93,466, a difference of 0.11%), German ($93,531, a difference of 0.18%), Guamanian/Chamorro ($93,569, a difference of 0.22%), and Immigrants from Sierra Leone ($93,115, a difference of 0.27%).
| Demographics | Rating | Rank | Householder Income Ages 25 - 44 years |
| French | 37.8 /100 | #180 | Fair $93,665 |
| Puget Sound Salish | 37.7 /100 | #181 | Fair $93,661 |
| Uruguayans | 37.3 /100 | #182 | Fair $93,631 |
| Guamanians/Chamorros | 36.5 /100 | #183 | Fair $93,569 |
| Germans | 36.0 /100 | #184 | Fair $93,531 |
| Immigrants | Eritrea | 35.2 /100 | #185 | Fair $93,466 |
| Sierra Leoneans | 34.8 /100 | #186 | Fair $93,435 |
| Spaniards | 34.0 /100 | #187 | Fair $93,366 |
| Immigrants | Sierra Leone | 30.9 /100 | #188 | Fair $93,115 |
| Dutch | 30.5 /100 | #189 | Fair $93,081 |
| Welsh | 30.0 /100 | #190 | Fair $93,039 |
| Tlingit-Haida | 29.4 /100 | #191 | Fair $92,987 |
| Immigrants | Costa Rica | 28.2 /100 | #192 | Fair $92,876 |
| Samoans | 23.0 /100 | #193 | Fair $92,385 |
| Immigrants | Azores | 22.4 /100 | #194 | Fair $92,322 |
Demographics Similar to Immigrants from South Central Asia by Householder Income Ages 25 - 44 years
In terms of householder income ages 25 - 44 years, the demographic groups most similar to Immigrants from South Central Asia are Cypriot ($116,364, a difference of 0.23%), Immigrants from Israel ($117,219, a difference of 0.51%), Immigrants from Australia ($115,947, a difference of 0.59%), Immigrants from Eastern Asia ($118,056, a difference of 1.2%), and Eastern European ($114,523, a difference of 1.8%).
| Demographics | Rating | Rank | Householder Income Ages 25 - 44 years |
| Iranians | 100.0 /100 | #8 | Exceptional $120,292 |
| Immigrants | China | 100.0 /100 | #9 | Exceptional $119,756 |
| Indians (Asian) | 100.0 /100 | #10 | Exceptional $119,496 |
| Okinawans | 100.0 /100 | #11 | Exceptional $119,349 |
| Immigrants | Iran | 100.0 /100 | #12 | Exceptional $119,204 |
| Immigrants | Eastern Asia | 100.0 /100 | #13 | Exceptional $118,056 |
| Immigrants | Israel | 100.0 /100 | #14 | Exceptional $117,219 |
| Immigrants | South Central Asia | 100.0 /100 | #15 | Exceptional $116,626 |
| Cypriots | 100.0 /100 | #16 | Exceptional $116,364 |
| Immigrants | Australia | 100.0 /100 | #17 | Exceptional $115,947 |
| Eastern Europeans | 100.0 /100 | #18 | Exceptional $114,523 |
| Burmese | 100.0 /100 | #19 | Exceptional $113,701 |
| Immigrants | Korea | 100.0 /100 | #20 | Exceptional $113,401 |
| Asians | 100.0 /100 | #21 | Exceptional $112,666 |
| Immigrants | Belgium | 100.0 /100 | #22 | Exceptional $112,575 |