Spaniard vs Lithuanian 1st Grade
COMPARE
Spaniard
Lithuanian
1st Grade
1st Grade Comparison
Spaniards
Lithuanians
98.1%
1ST GRADE
91.2/ 100
METRIC RATING
131st/ 347
METRIC RANK
98.6%
1ST GRADE
100.0/ 100
METRIC RATING
24th/ 347
METRIC RANK
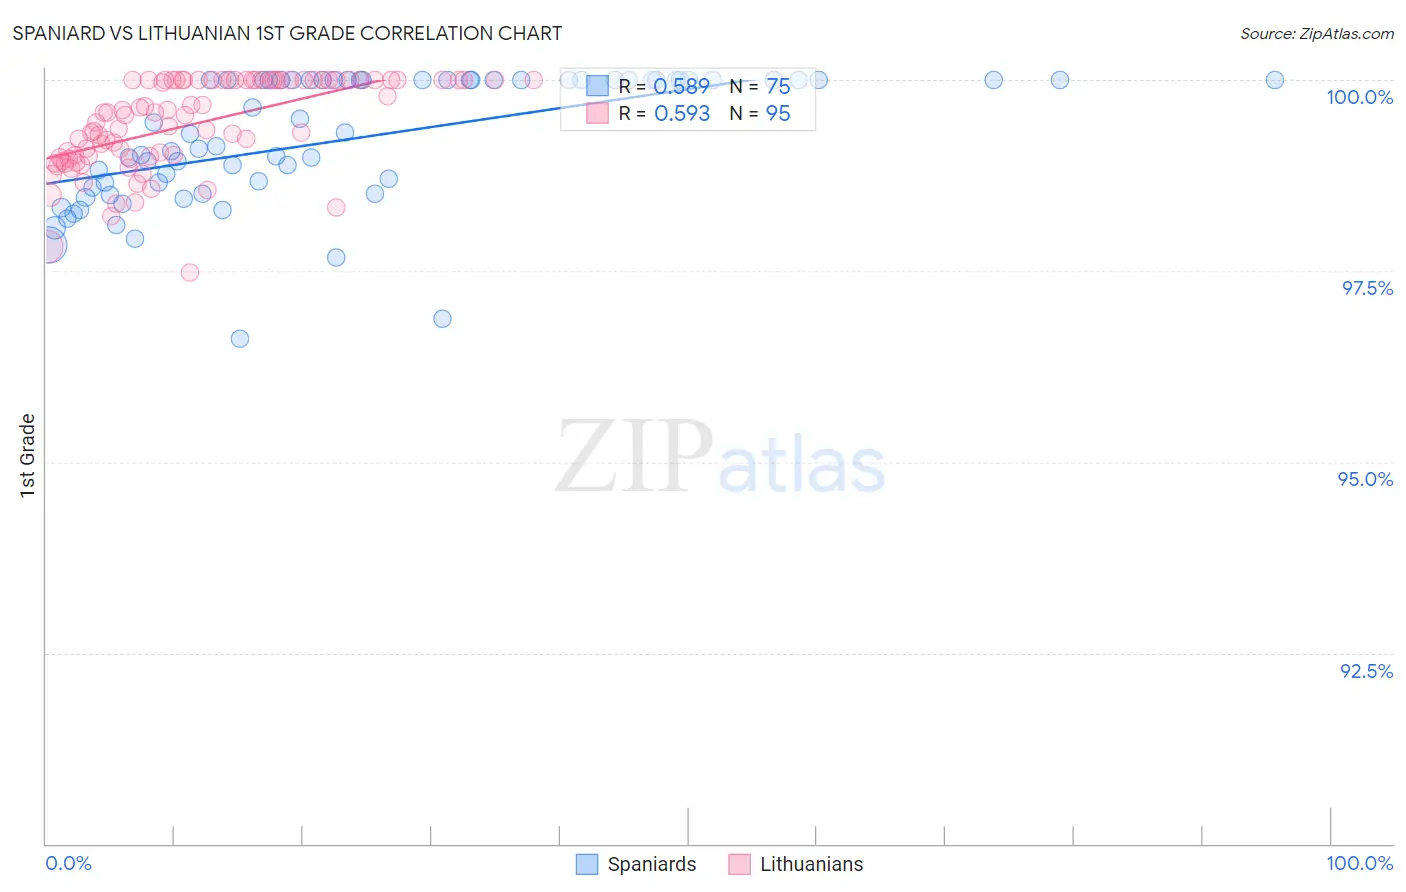
Spaniard vs Lithuanian 1st Grade Correlation Chart
The statistical analysis conducted on geographies consisting of 443,544,503 people shows a substantial positive correlation between the proportion of Spaniards and percentage of population with at least 1st grade education in the United States with a correlation coefficient (R) of 0.589 and weighted average of 98.1%. Similarly, the statistical analysis conducted on geographies consisting of 421,946,231 people shows a substantial positive correlation between the proportion of Lithuanians and percentage of population with at least 1st grade education in the United States with a correlation coefficient (R) of 0.593 and weighted average of 98.6%, a difference of 0.49%.
1st Grade Correlation Summary
| Measurement | Spaniard | Lithuanian |
| Minimum | 96.6% | 97.5% |
| Maximum | 100.0% | 100.0% |
| Range | 3.4% | 2.5% |
| Mean | 99.2% | 99.4% |
| Median | 99.3% | 99.5% |
| Interquartile 25% (IQ1) | 98.6% | 99.0% |
| Interquartile 75% (IQ3) | 100.0% | 100.0% |
| Interquartile Range (IQR) | 1.4% | 1.0% |
| Standard Deviation (Sample) | 0.84% | 0.59% |
| Standard Deviation (Population) | 0.84% | 0.59% |
Similar Demographics by 1st Grade
Demographics Similar to Spaniards by 1st Grade
In terms of 1st grade, the demographic groups most similar to Spaniards are Immigrants from Croatia (98.1%, a difference of 0.0%), Cambodian (98.1%, a difference of 0.0%), Immigrants from Serbia (98.1%, a difference of 0.010%), Seminole (98.1%, a difference of 0.010%), and Immigrants from Europe (98.1%, a difference of 0.010%).
| Demographics | Rating | Rank | 1st Grade |
| Syrians | 93.7 /100 | #124 | Exceptional 98.1% |
| Immigrants | Japan | 93.7 /100 | #125 | Exceptional 98.1% |
| Lebanese | 93.5 /100 | #126 | Exceptional 98.1% |
| Immigrants | Saudi Arabia | 93.3 /100 | #127 | Exceptional 98.1% |
| Immigrants | Serbia | 92.2 /100 | #128 | Exceptional 98.1% |
| Seminole | 91.9 /100 | #129 | Exceptional 98.1% |
| Immigrants | Croatia | 91.4 /100 | #130 | Exceptional 98.1% |
| Spaniards | 91.2 /100 | #131 | Exceptional 98.1% |
| Cambodians | 90.9 /100 | #132 | Exceptional 98.1% |
| Immigrants | Europe | 90.5 /100 | #133 | Exceptional 98.1% |
| Immigrants | Hungary | 89.4 /100 | #134 | Excellent 98.1% |
| Immigrants | Kuwait | 89.3 /100 | #135 | Excellent 98.1% |
| Immigrants | Bulgaria | 88.8 /100 | #136 | Excellent 98.1% |
| Israelis | 87.8 /100 | #137 | Excellent 98.1% |
| Immigrants | Romania | 87.8 /100 | #138 | Excellent 98.1% |
Demographics Similar to Lithuanians by 1st Grade
In terms of 1st grade, the demographic groups most similar to Lithuanians are Sioux (98.6%, a difference of 0.0%), Arapaho (98.6%, a difference of 0.0%), Pennsylvania German (98.6%, a difference of 0.0%), Finnish (98.6%, a difference of 0.0%), and Danish (98.6%, a difference of 0.0%).
| Demographics | Rating | Rank | 1st Grade |
| Scottish | 100.0 /100 | #17 | Exceptional 98.6% |
| Dutch | 100.0 /100 | #18 | Exceptional 98.6% |
| Irish | 100.0 /100 | #19 | Exceptional 98.6% |
| Sioux | 100.0 /100 | #20 | Exceptional 98.6% |
| Arapaho | 100.0 /100 | #21 | Exceptional 98.6% |
| Pennsylvania Germans | 100.0 /100 | #22 | Exceptional 98.6% |
| Finns | 100.0 /100 | #23 | Exceptional 98.6% |
| Lithuanians | 100.0 /100 | #24 | Exceptional 98.6% |
| Danes | 100.0 /100 | #25 | Exceptional 98.6% |
| Scotch-Irish | 100.0 /100 | #26 | Exceptional 98.6% |
| Poles | 100.0 /100 | #27 | Exceptional 98.6% |
| Croatians | 100.0 /100 | #28 | Exceptional 98.6% |
| French | 100.0 /100 | #29 | Exceptional 98.6% |
| Europeans | 100.0 /100 | #30 | Exceptional 98.5% |
| Czechs | 100.0 /100 | #31 | Exceptional 98.5% |