Alaska Native vs Immigrants from Romania 6th Grade
COMPARE
Alaska Native
Immigrants from Romania
6th Grade
6th Grade Comparison
Alaska Natives
Immigrants from Romania
98.0%
6TH GRADE
100.0/ 100
METRIC RATING
32nd/ 347
METRIC RANK
97.3%
6TH GRADE
92.0/ 100
METRIC RATING
128th/ 347
METRIC RANK
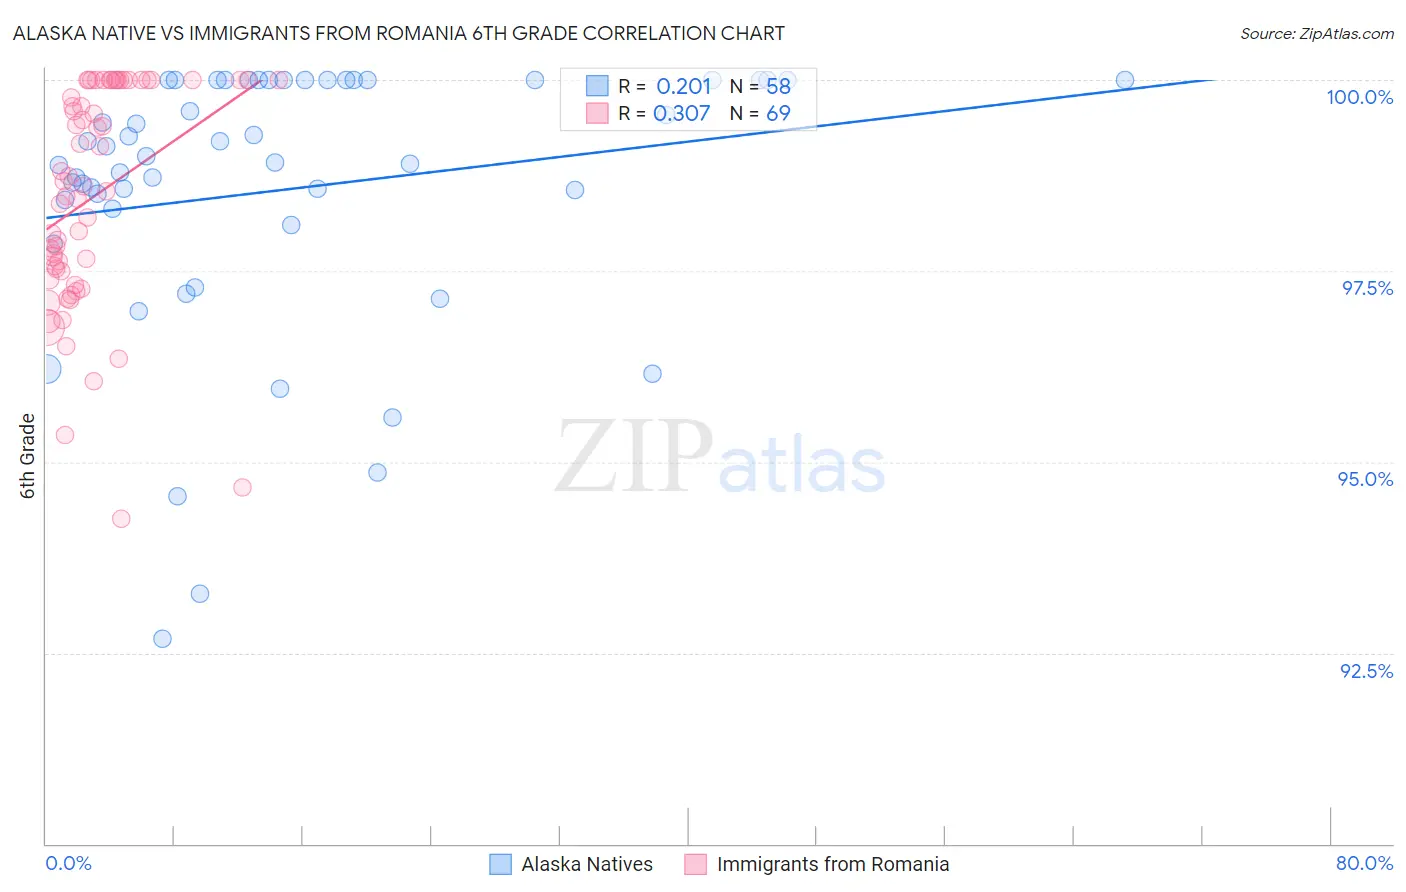
Alaska Native vs Immigrants from Romania 6th Grade Correlation Chart
The statistical analysis conducted on geographies consisting of 76,778,057 people shows a weak positive correlation between the proportion of Alaska Natives and percentage of population with at least 6th grade education in the United States with a correlation coefficient (R) of 0.201 and weighted average of 98.0%. Similarly, the statistical analysis conducted on geographies consisting of 257,008,799 people shows a mild positive correlation between the proportion of Immigrants from Romania and percentage of population with at least 6th grade education in the United States with a correlation coefficient (R) of 0.307 and weighted average of 97.3%, a difference of 0.68%.
6th Grade Correlation Summary
| Measurement | Alaska Native | Immigrants from Romania |
| Minimum | 92.7% | 94.3% |
| Maximum | 100.0% | 100.0% |
| Range | 7.3% | 5.7% |
| Mean | 98.6% | 98.5% |
| Median | 99.0% | 98.6% |
| Interquartile 25% (IQ1) | 98.3% | 97.4% |
| Interquartile 75% (IQ3) | 100.0% | 100.0% |
| Interquartile Range (IQR) | 1.7% | 2.6% |
| Standard Deviation (Sample) | 1.7% | 1.4% |
| Standard Deviation (Population) | 1.7% | 1.4% |
Similar Demographics by 6th Grade
Demographics Similar to Alaska Natives by 6th Grade
In terms of 6th grade, the demographic groups most similar to Alaska Natives are French Canadian (98.0%, a difference of 0.010%), European (98.0%, a difference of 0.010%), Yup'ik (98.0%, a difference of 0.020%), Scandinavian (98.0%, a difference of 0.020%), and French (98.0%, a difference of 0.020%).
| Demographics | Rating | Rank | 6th Grade |
| Scotch-Irish | 100.0 /100 | #25 | Exceptional 98.0% |
| Czechs | 100.0 /100 | #26 | Exceptional 98.0% |
| Yup'ik | 100.0 /100 | #27 | Exceptional 98.0% |
| Scandinavians | 100.0 /100 | #28 | Exceptional 98.0% |
| French | 100.0 /100 | #29 | Exceptional 98.0% |
| French Canadians | 100.0 /100 | #30 | Exceptional 98.0% |
| Europeans | 100.0 /100 | #31 | Exceptional 98.0% |
| Alaska Natives | 100.0 /100 | #32 | Exceptional 98.0% |
| Chippewa | 100.0 /100 | #33 | Exceptional 97.9% |
| Swiss | 100.0 /100 | #34 | Exceptional 97.9% |
| Chinese | 100.0 /100 | #35 | Exceptional 97.9% |
| Italians | 100.0 /100 | #36 | Exceptional 97.9% |
| British | 100.0 /100 | #37 | Exceptional 97.9% |
| Belgians | 100.0 /100 | #38 | Exceptional 97.9% |
| Luxembourgers | 99.9 /100 | #39 | Exceptional 97.9% |
Demographics Similar to Immigrants from Romania by 6th Grade
In terms of 6th grade, the demographic groups most similar to Immigrants from Romania are Immigrants from Serbia (97.3%, a difference of 0.0%), Cambodian (97.3%, a difference of 0.0%), Immigrants from Europe (97.3%, a difference of 0.010%), Immigrants from Croatia (97.3%, a difference of 0.020%), and Palestinian (97.3%, a difference of 0.020%).
| Demographics | Rating | Rank | 6th Grade |
| Immigrants | Norway | 94.7 /100 | #121 | Exceptional 97.4% |
| Immigrants | France | 94.5 /100 | #122 | Exceptional 97.4% |
| Hmong | 94.4 /100 | #123 | Exceptional 97.4% |
| Okinawans | 94.2 /100 | #124 | Exceptional 97.4% |
| Spanish | 93.7 /100 | #125 | Exceptional 97.3% |
| Immigrants | Bulgaria | 93.6 /100 | #126 | Exceptional 97.3% |
| Immigrants | Croatia | 93.1 /100 | #127 | Exceptional 97.3% |
| Immigrants | Romania | 92.0 /100 | #128 | Exceptional 97.3% |
| Immigrants | Serbia | 91.9 /100 | #129 | Exceptional 97.3% |
| Cambodians | 91.8 /100 | #130 | Exceptional 97.3% |
| Immigrants | Europe | 91.1 /100 | #131 | Exceptional 97.3% |
| Palestinians | 90.9 /100 | #132 | Exceptional 97.3% |
| Immigrants | Moldova | 90.0 /100 | #133 | Excellent 97.3% |
| Immigrants | Kuwait | 89.5 /100 | #134 | Excellent 97.3% |
| Immigrants | Hungary | 89.5 /100 | #135 | Excellent 97.3% |